Edit a Dashboard
Data Analyst
The dashboard or reports contain different controls and you can edit or move, such as:
Also, the edit dashboard lets you explore the data from a tile, visualization, map, or floor plan. See Explore Data.
Edit an Existing Dashboard
- Navigate the folders to the dashboard you want to edit.
- Click the dashboard's name.
- Click the More Actions
 icon. A popup menu displays.
 - Click the Edit dashboard menu item.
The dashboard display in the edit mode.
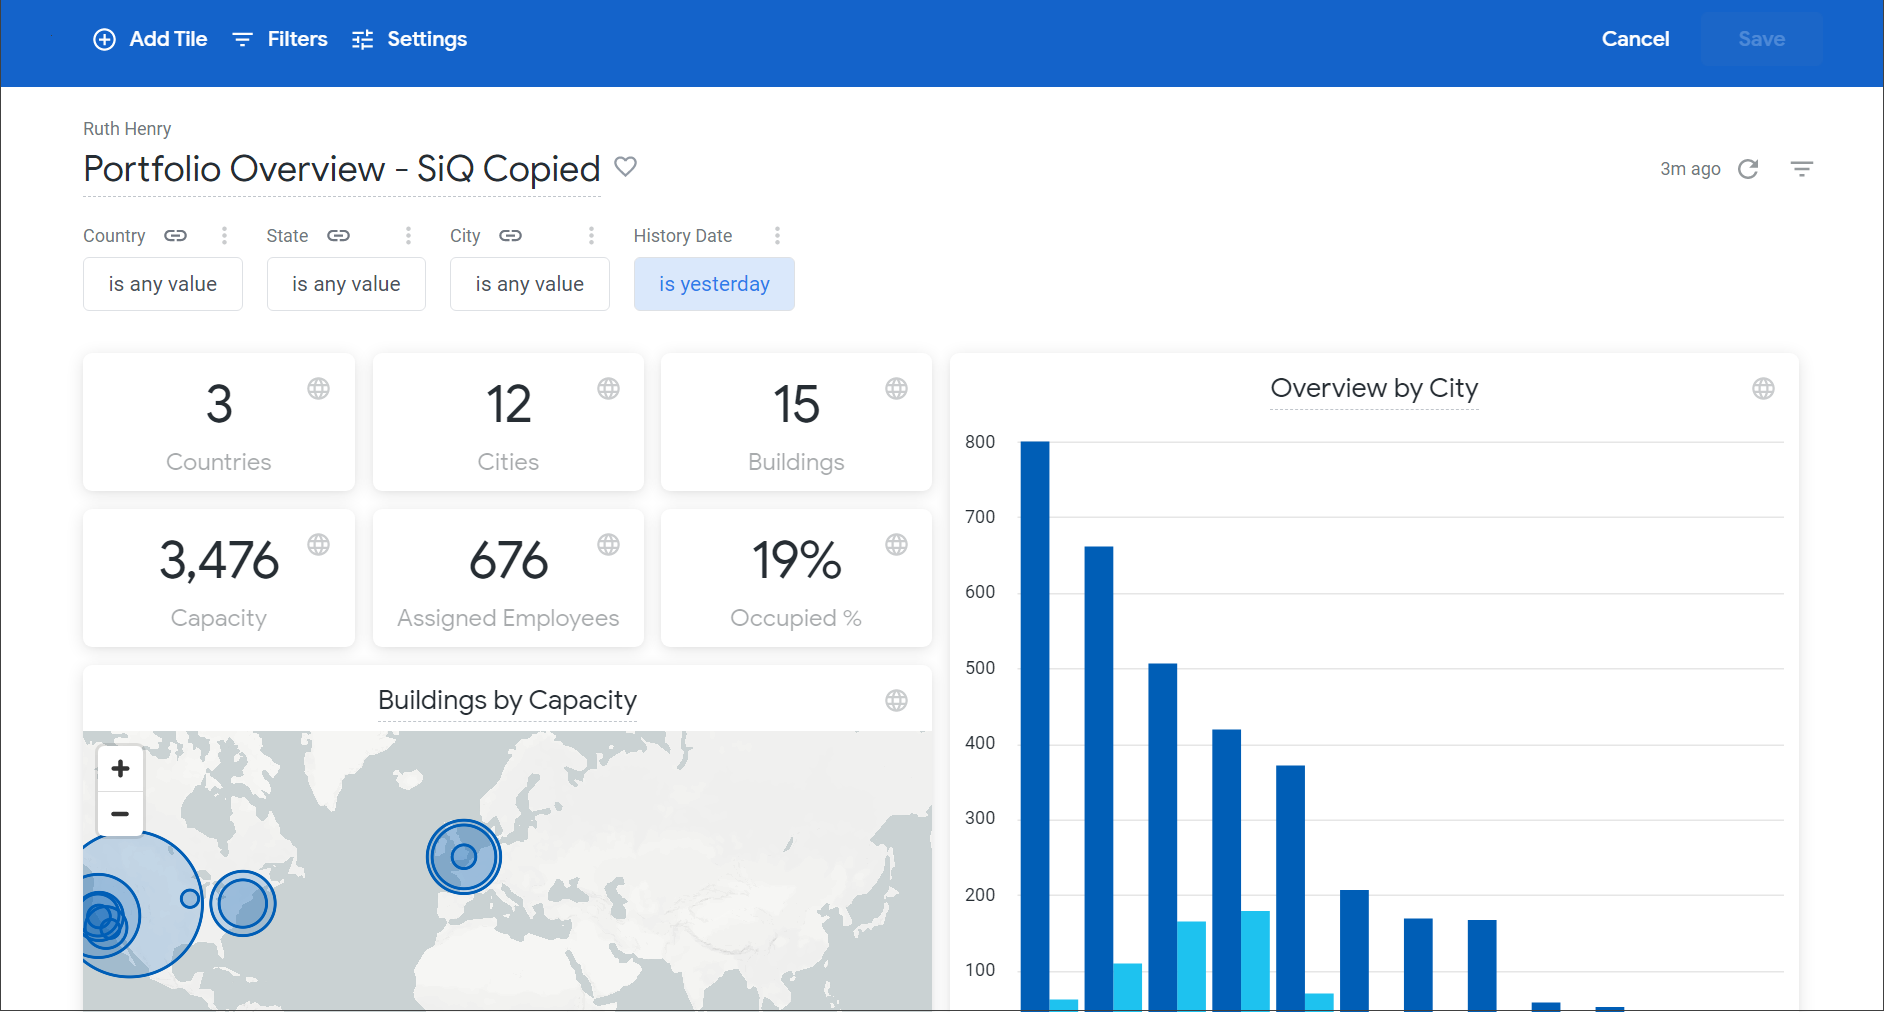
Some dashboards will open with the filters applied, and in other dashboards, you will need to apply the filters before the dashboard's details will display.
![]()
Watch the videos in the Looker Documentation to find more about how to edit filters, tiles, etc in Edit User-defined Dashboards.
Edit Filters
When the dashboard contains filters you can edit these.
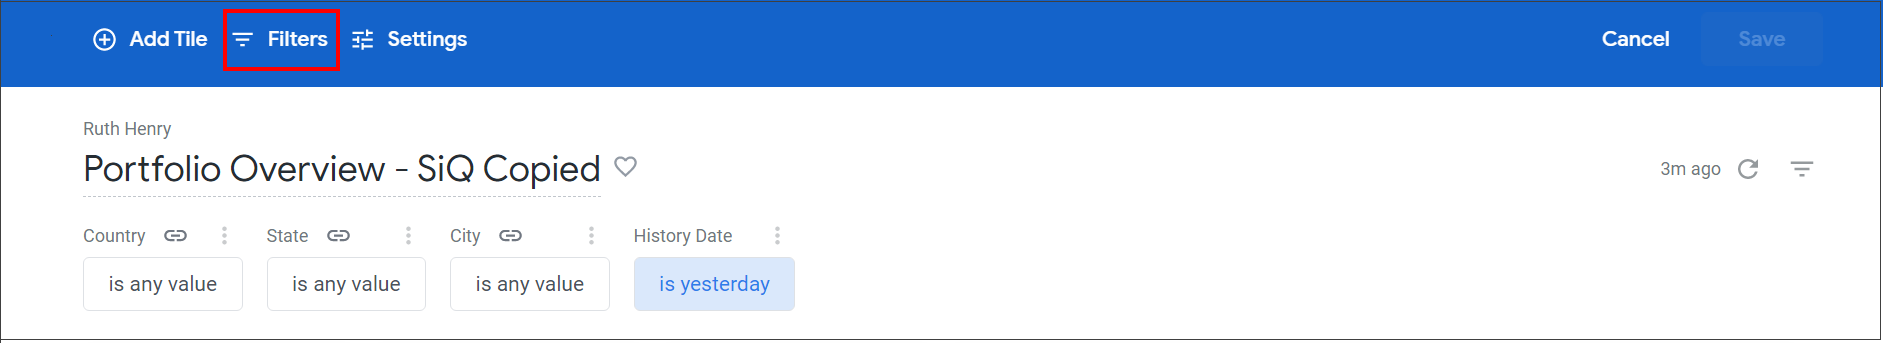
- Click the Filters icon. The Add/Edit Dashboard Filters dialog displays.
- Refer to the Looker documentation for guidance.
Edit Tiles
When the dashboard contains tile(s) you can edit the tile.
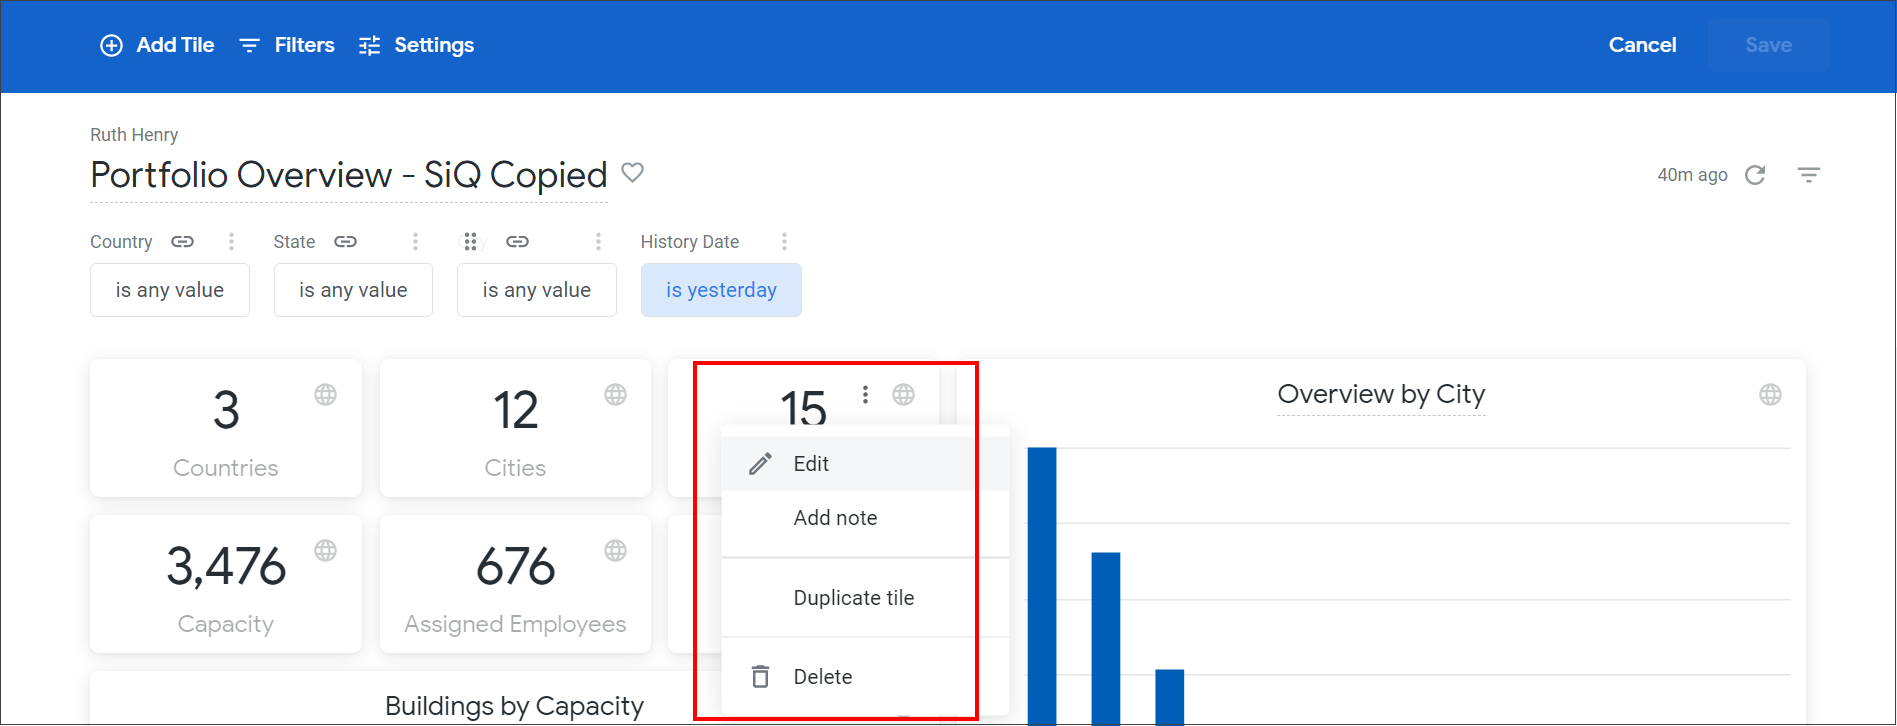
- Hover over the tile to display the icons.
- Click the More Action icon. The edit menu displays.
- Refer to the Looker documentation for guidance.
Move Tiles
You can easily move the tiles in the dashboard.
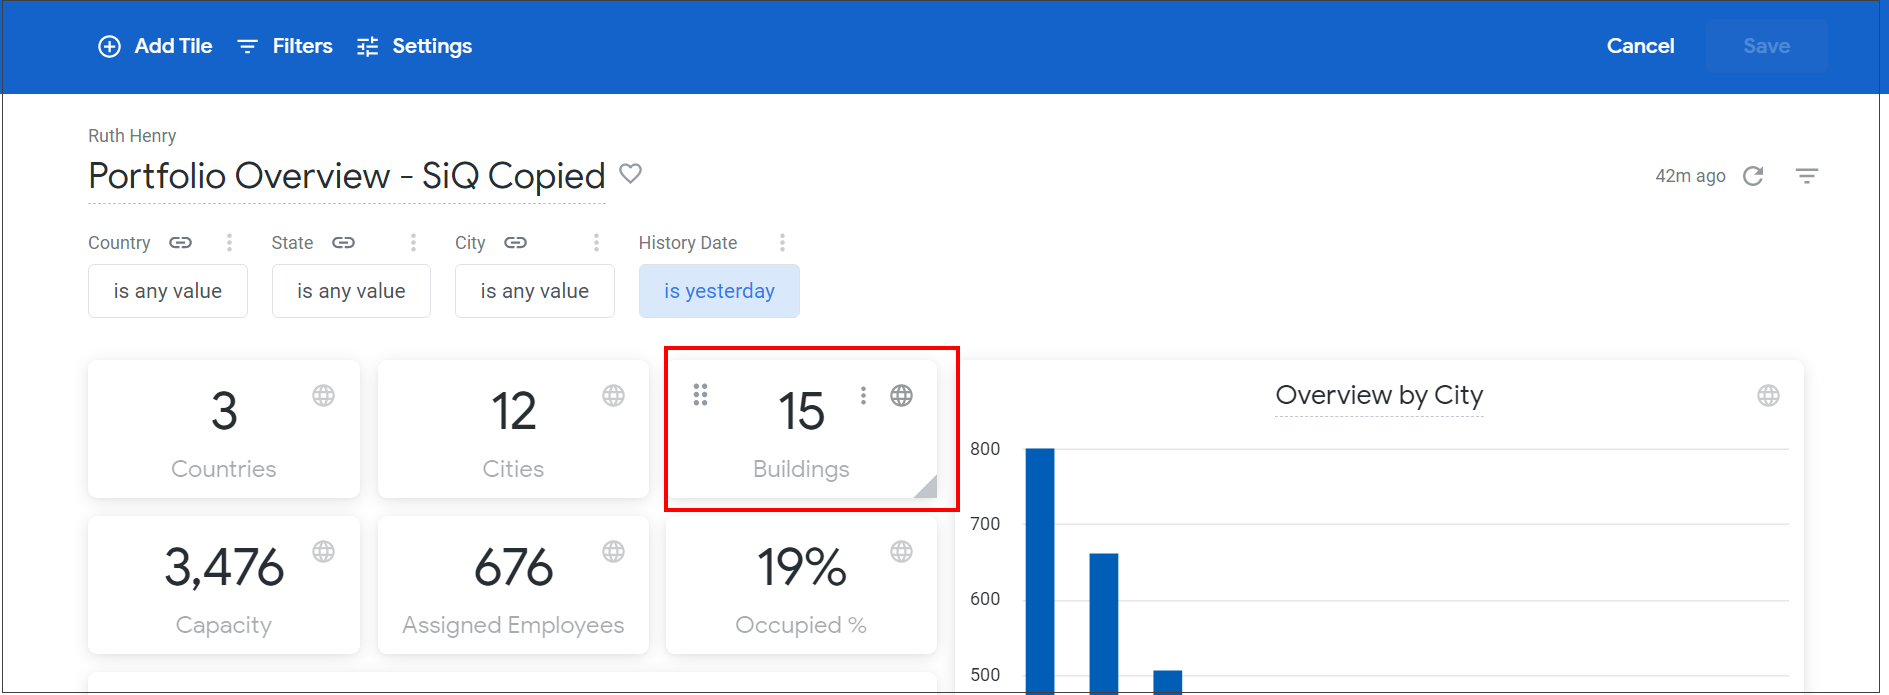
- Hover over the tile to display the icons.
- Click the Move
 icon and then drag and drop the tile to the new position.
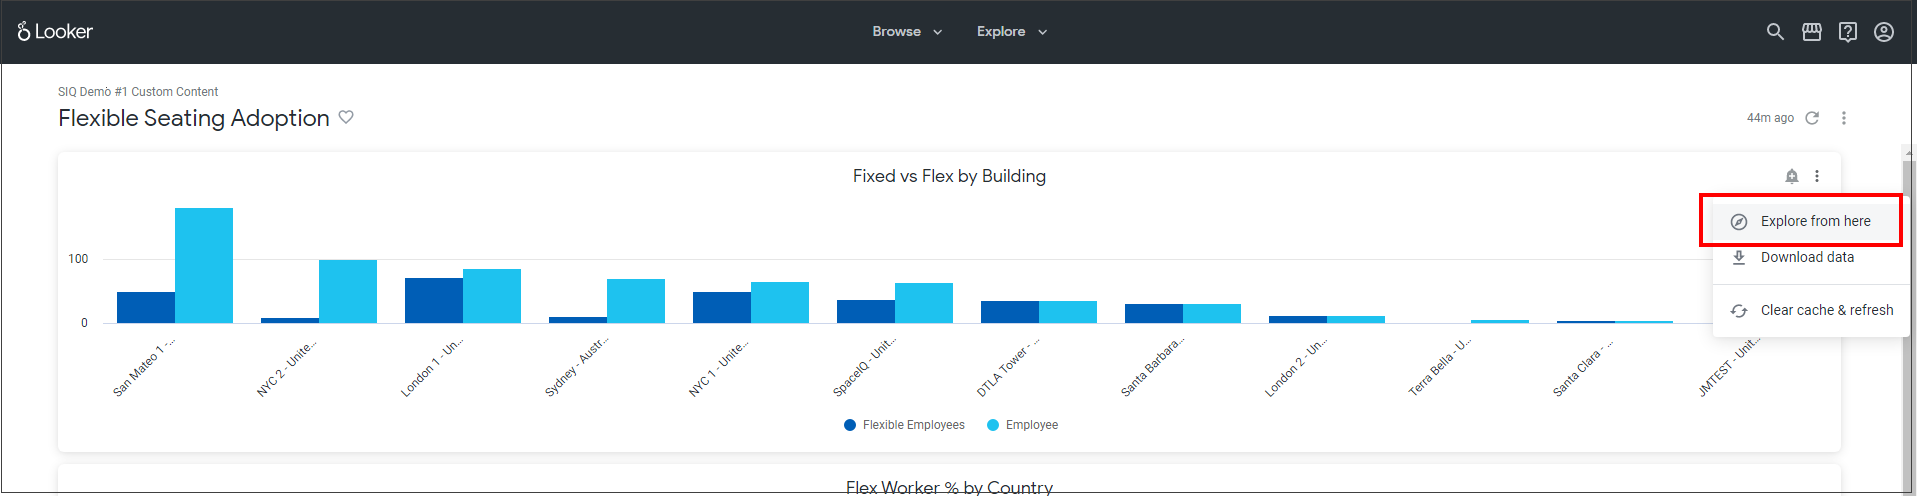
Explore the Data from a Tile, Visualization, Map, or Floorplan
The Edit Dashboards lets you explore the data from a tile, visualization, map, or floor plan.
- Hover over the tile, visualization, map, or floor plan to display the icons.
- Click the More Actions icon.
- Click Edit.
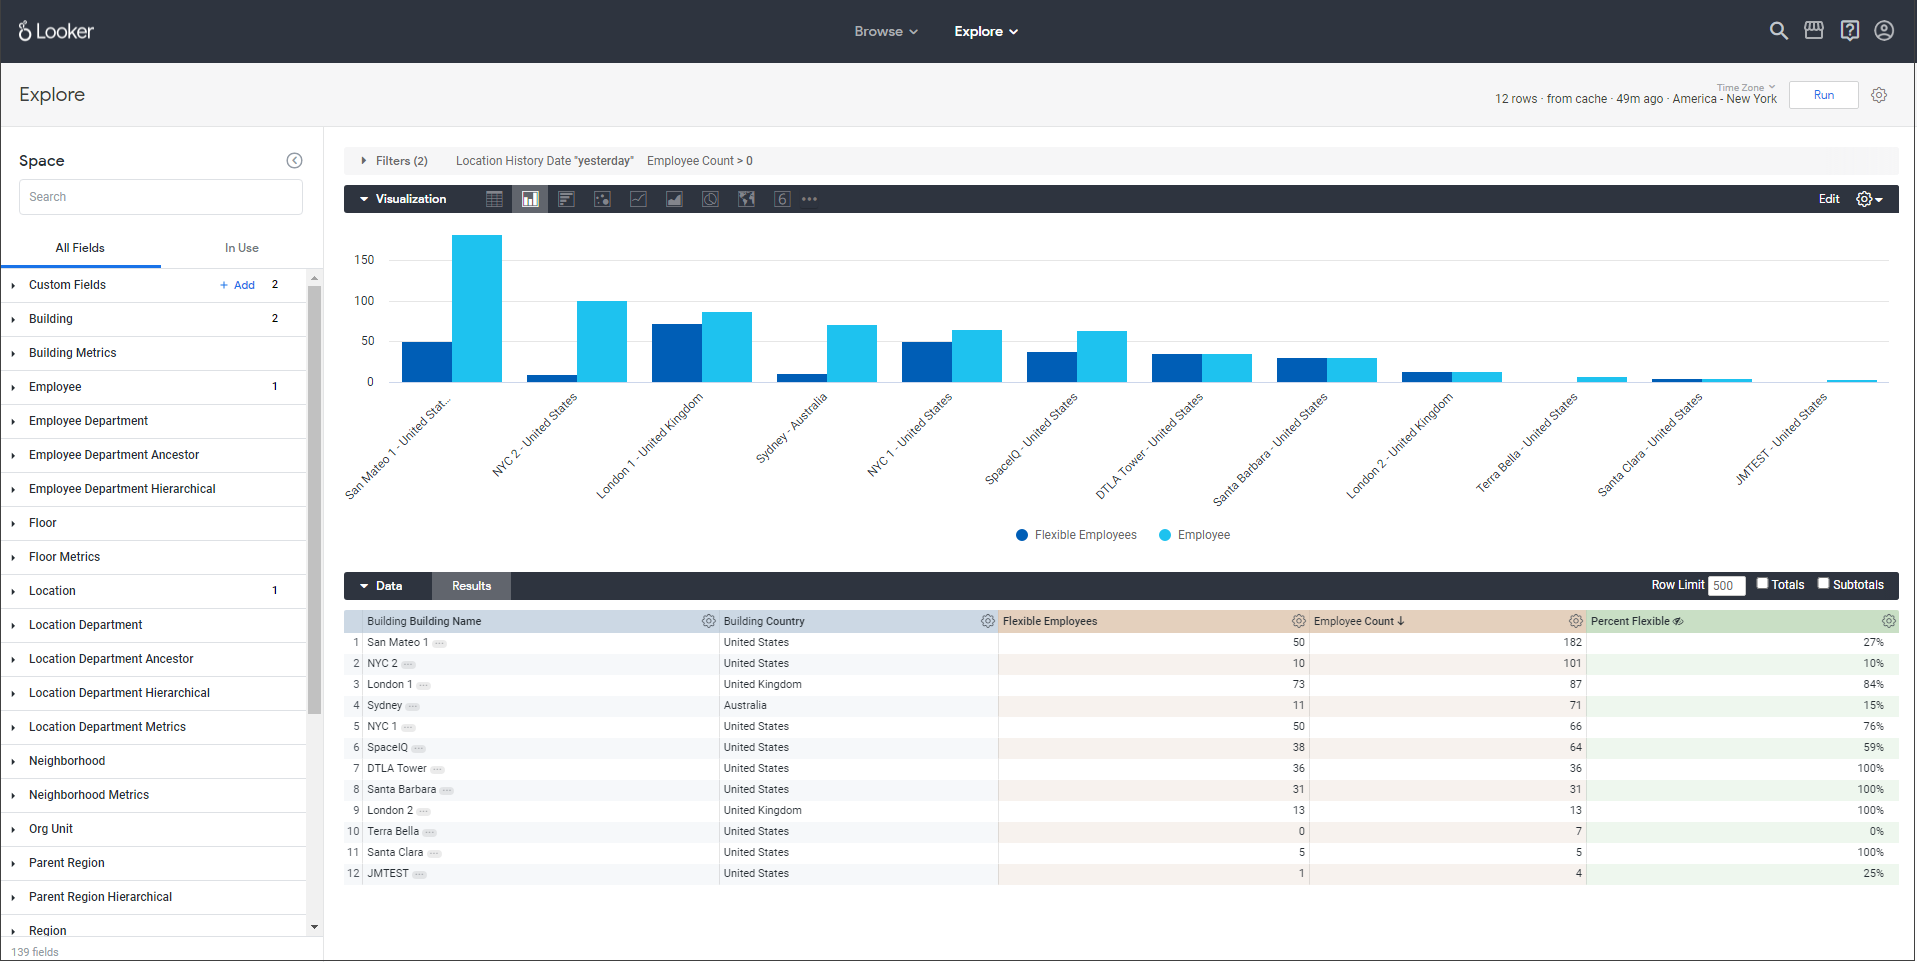
This will display the Explore and remember. Some dashboards will open with the filters applied and for other dashboards, you will need to apply the filters before the dashboard's details will display.
This will display the Explore and remember. Some dashboards will open with the filters applied, and for other dashboards, you will need to apply the filters before the dashboard's details display.
The Looker documentation below will provide you with guidance on how to explore, and we have the following:
- SiQ Insights Explores and the SiQ Data Dictionary, where you will find the labels, descriptions, SQL definitions, and more.
![]()
Watch the videos in the Looker Documentation to find more about how to explore data.
Edit Visualization
When the dashboard contains a visualization, you can either move, hide, or edit the visualization
- Hover over the visualization to display the icons.
- Refer to the Looker documentation for guidance.
Edit Maps
When the dashboard contains a map you can either move, hide, or edit the map.
- Hover over the map to display the icons.
- Refer to the Looker documentation for guidance.