Overall Seats Utilization Report
Purpose
Provides information about utilization by availability, occupancy, and space usage.
Navigate
From the top menu, click Report icon. Then from the Reports module, click Sensor Insights > Overall Seats Utilization.
Special Filters
You can apply filters to the graphs and tables and when the filter is applied the Filter icon will display the exact number. If needed the filters can shown/hidden, click the Filter icon and to clear the filter click X icon or clear all the filters, click the filter results X icon.
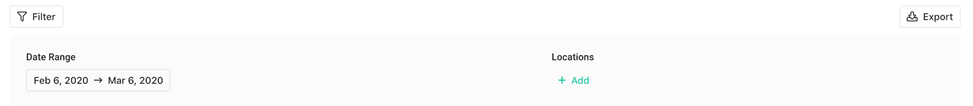
- Date Range Filter - Select the date range. This displays the utilization for the start and end date.
- Locations Filter - Select the location(s). This displays the utilization for the selected locations.
- Department Filter - Select the department(s). This displays the utilization for the selected departments.
- Usage Types Filter - Select the usage type(s). This displays the utilization for the selected usage type.
Special Data Elements
By default, the page is loaded without any filters applied and for the current assignment plan. When you apply the filters the results automatically display.
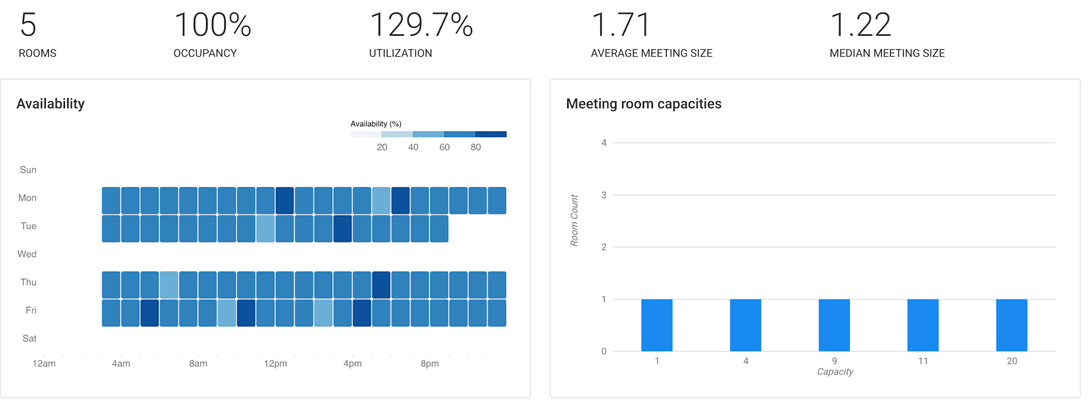
Key Performance Indicators
- Spaces - Number of spaces
- Occupancy - Percent of working hours the room is occupied physically by people
Availability Graph
- Represents the availability per day/hours.
- Hover over the bar to display more information.
Occupancy Graph
- Represents the total occupancy per day count.
- Hover over the bar to display more information.
Space Usage Graph
- Represents the total count of space usage types.
- Hover over the bar to display more information.
Seats Utilization Table

The table consists of the following columns:
| Column | Description | Type |
|---|---|---|
| City | City name | Text |
| Building | Building name | Text |
| Floor | Floor name | Text |
| Space# | Space code | Text |
| Occupancy (%) | Average actual occupancy, measured by sensors. | Number |
Sort Columns
By default, the columns are not sorted. You can sort the column, click the header to sort either ascending or descending.
Export
The export of the data is super quick, click the Export icon (top right). If you want all the data then make sure all the filters have been removed or if there are filters applied then the export will only export the filtered data to a CSV file.