Hotel Desk Report
Purpose
Hotel Desk Report provides an overview of your hotel desk bookings that include bookings by department, building, and booking distribution.
The Hotel Desk Report is different than the Desk Bookings Report. Hotel Desk Report provides an overview of your bookings by department, building, and booking distribution. The Hotel Desk Bookings Report provides detailed information about individual bookings.
Navigate to Hotel Desk Report
From the top menu, click the Report ![]() icon.
icon.
From the left menu, click the Agile Workplace and then click Hotel Desk. The Hotel Desk Report displays.
View Hotel Desk Report
This is an example of a Hotel Desk Report.
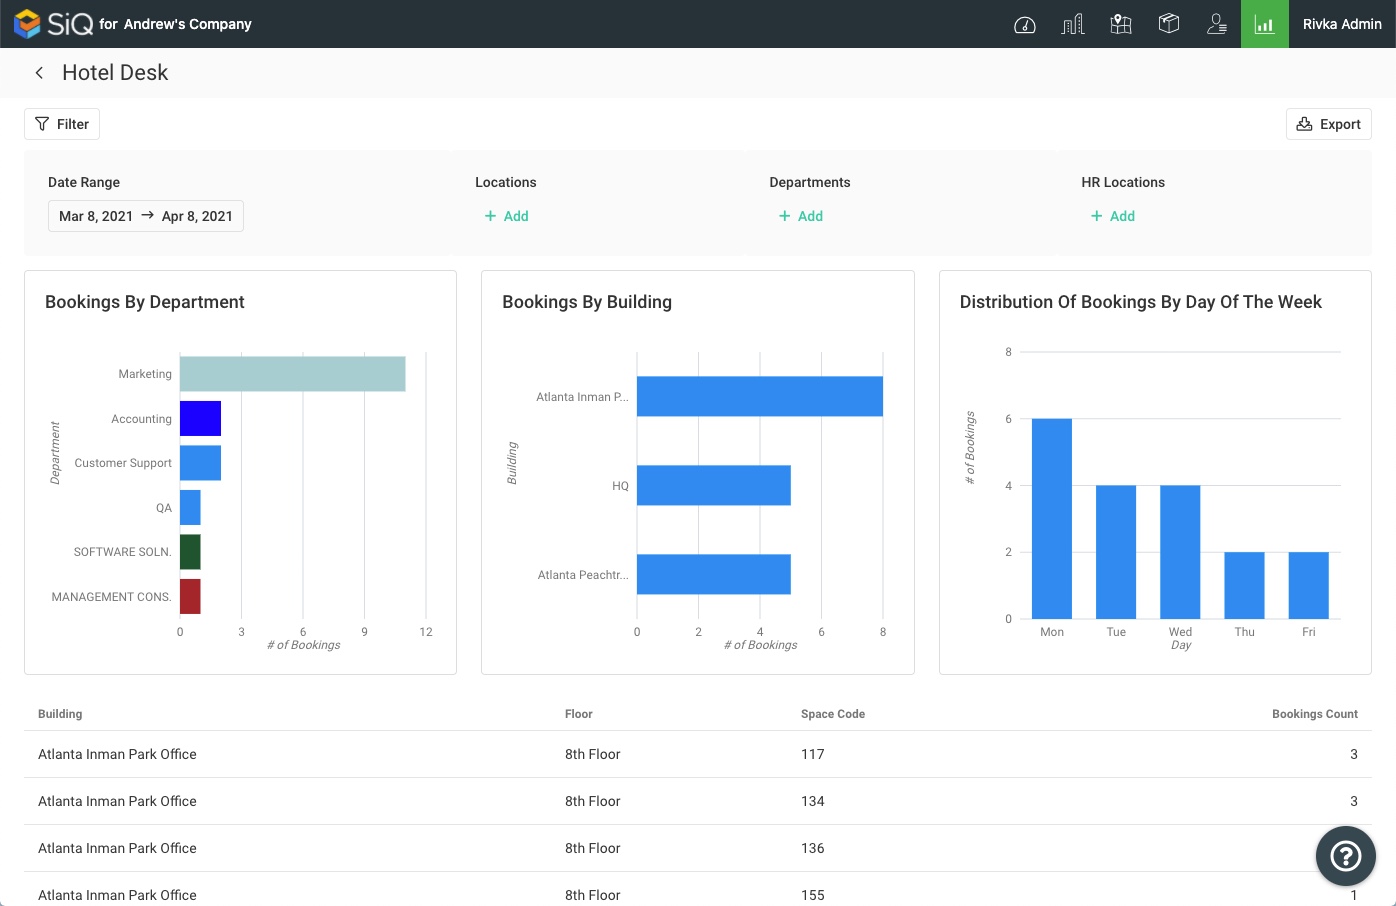
The report can be customized by applying filters.
Report Filters
Report filters give you additional insight into your hotel bookings. You can apply filters to each graph and table to modify your results.
Click on the Filter icon to select filters.
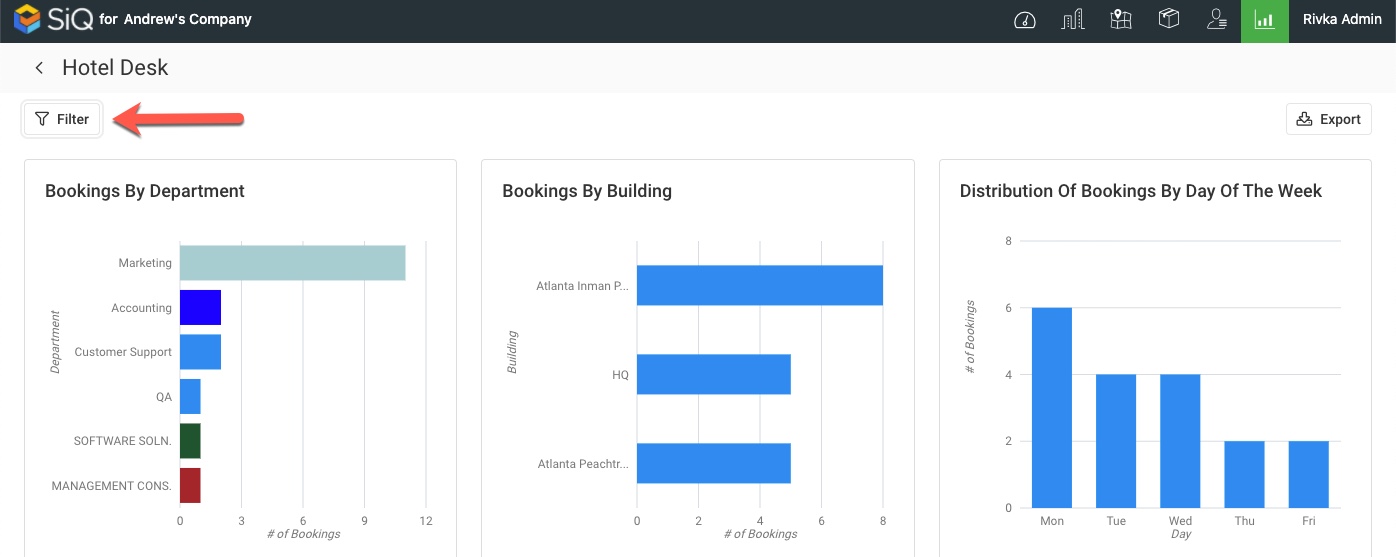
These are the available filters:
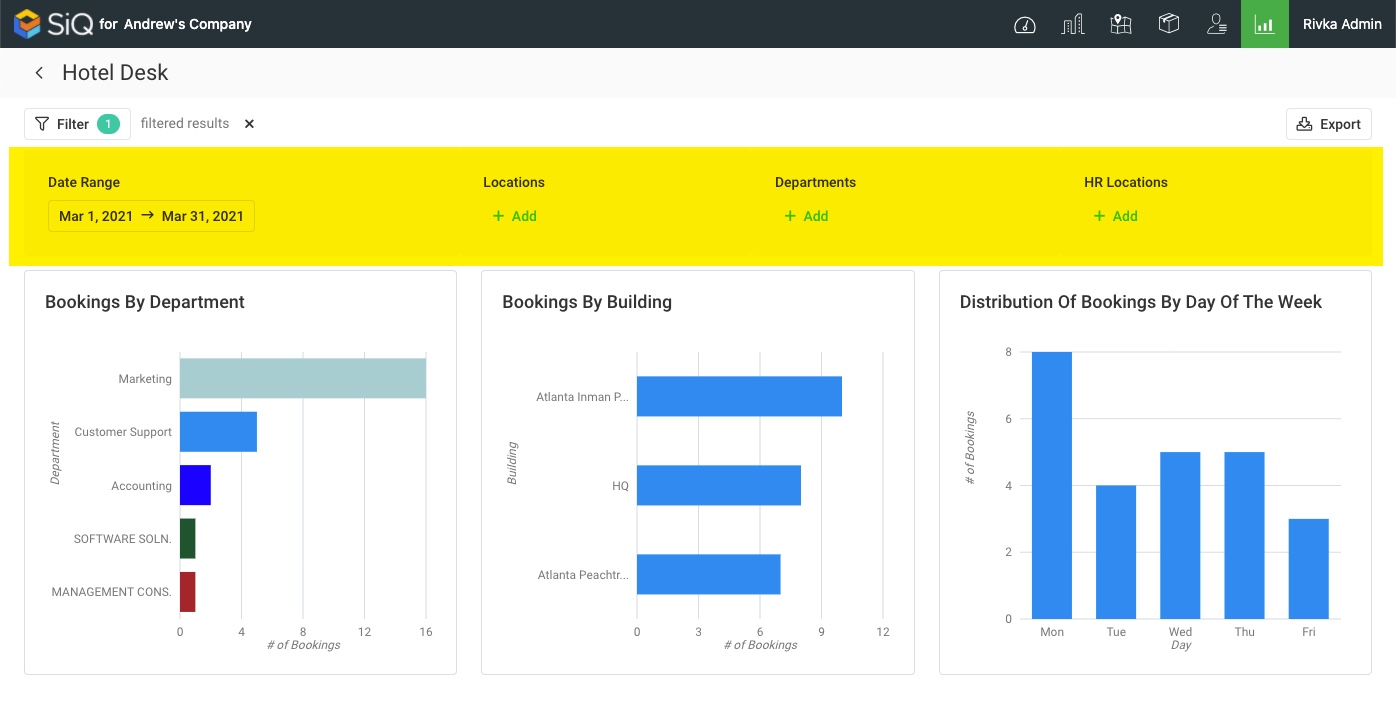
- Date Range Filter - Click to select a date range. This displays the bookings for the start and end date.
- Locations Filter - Click + to select one or more locations. This displays the hotel desk bookings for the selected locations. Selections can be removed by clicking the X next to each selection.
- Department Filter - Click + to select one or more departments. This displays the hotel desk bookings for the selected departments.
- HR Locations Filter - Click + to select one or more HR locations. This displays the information about hotel desk bookings from selected HR locations.
Special Data Elements
By default, the hotel desk reports are loaded for the current assignment plan and without any filters. When you apply filters, they are applied automatically.
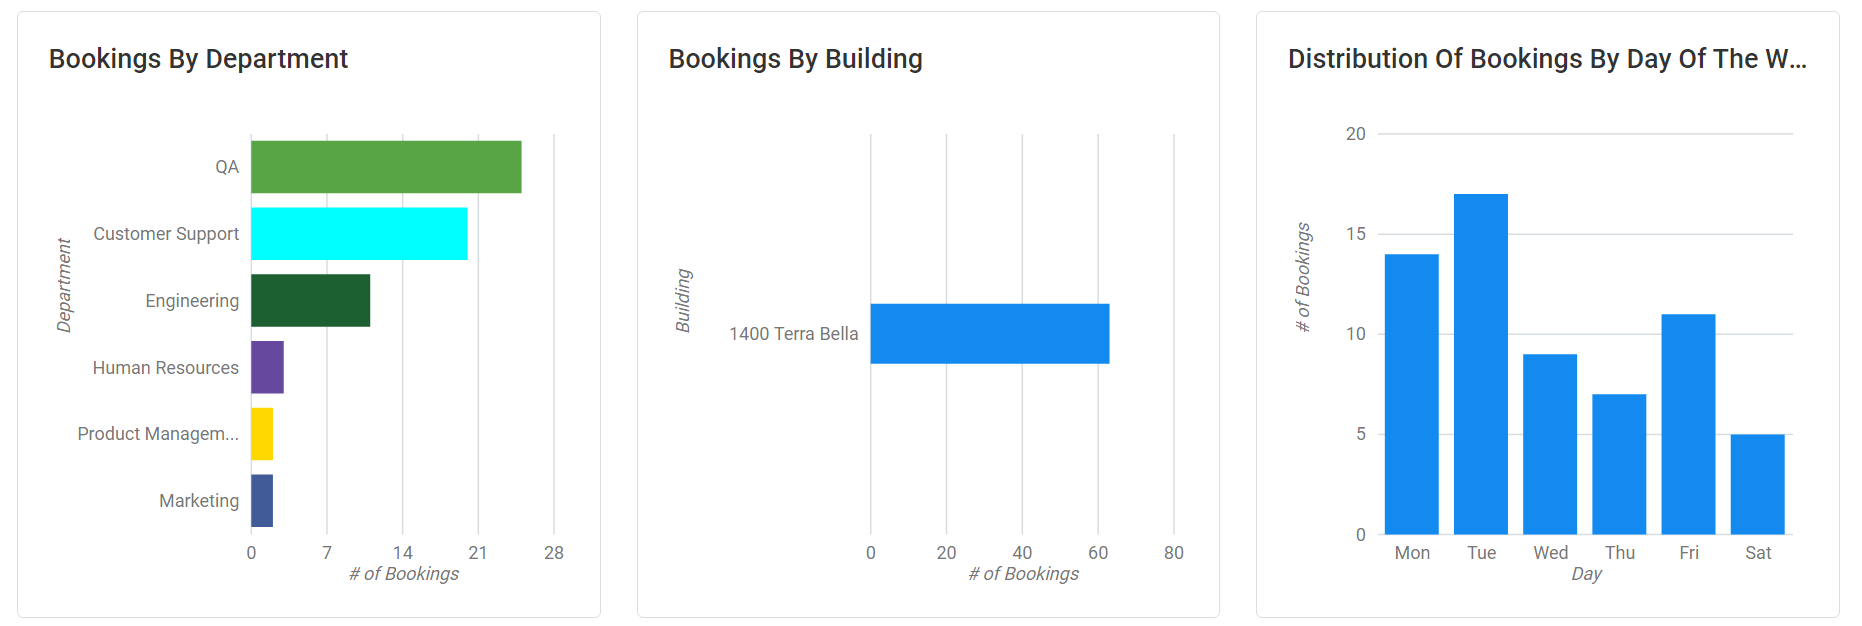
Bookings By Department Graph
Bookings by Department graph represents hotel desk bookings by department.
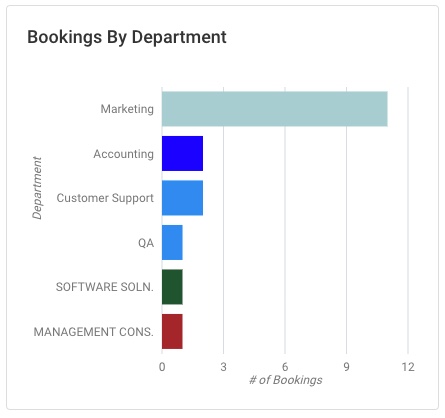
- Click on a bar to filter the results.
- Hover over the bar to display more information.
Bookings By Building Graph
Bookings by Building graph represent hotel desk bookings by building.
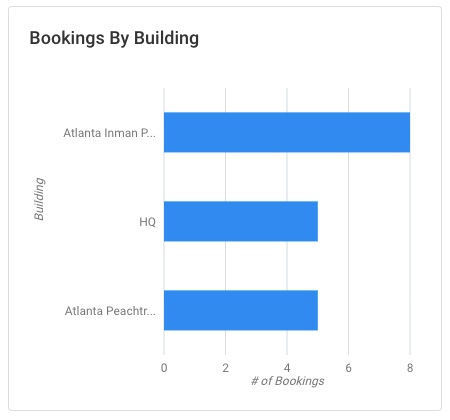
- Click on a bar to filter the results.
- Hover over the bar to display more information.
Distribution of Bookings by Day of the Week Graph
Distribution of Bookings by Day of the Week graph represents hotel desk bookings by day of the week.
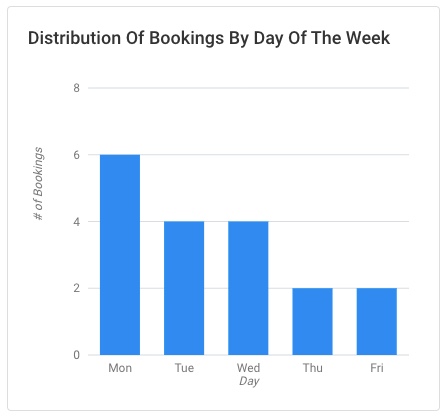
- Click on a bar to filter the results.
- Hover over the bar to display more information.
Hotel Desk Bookings Table
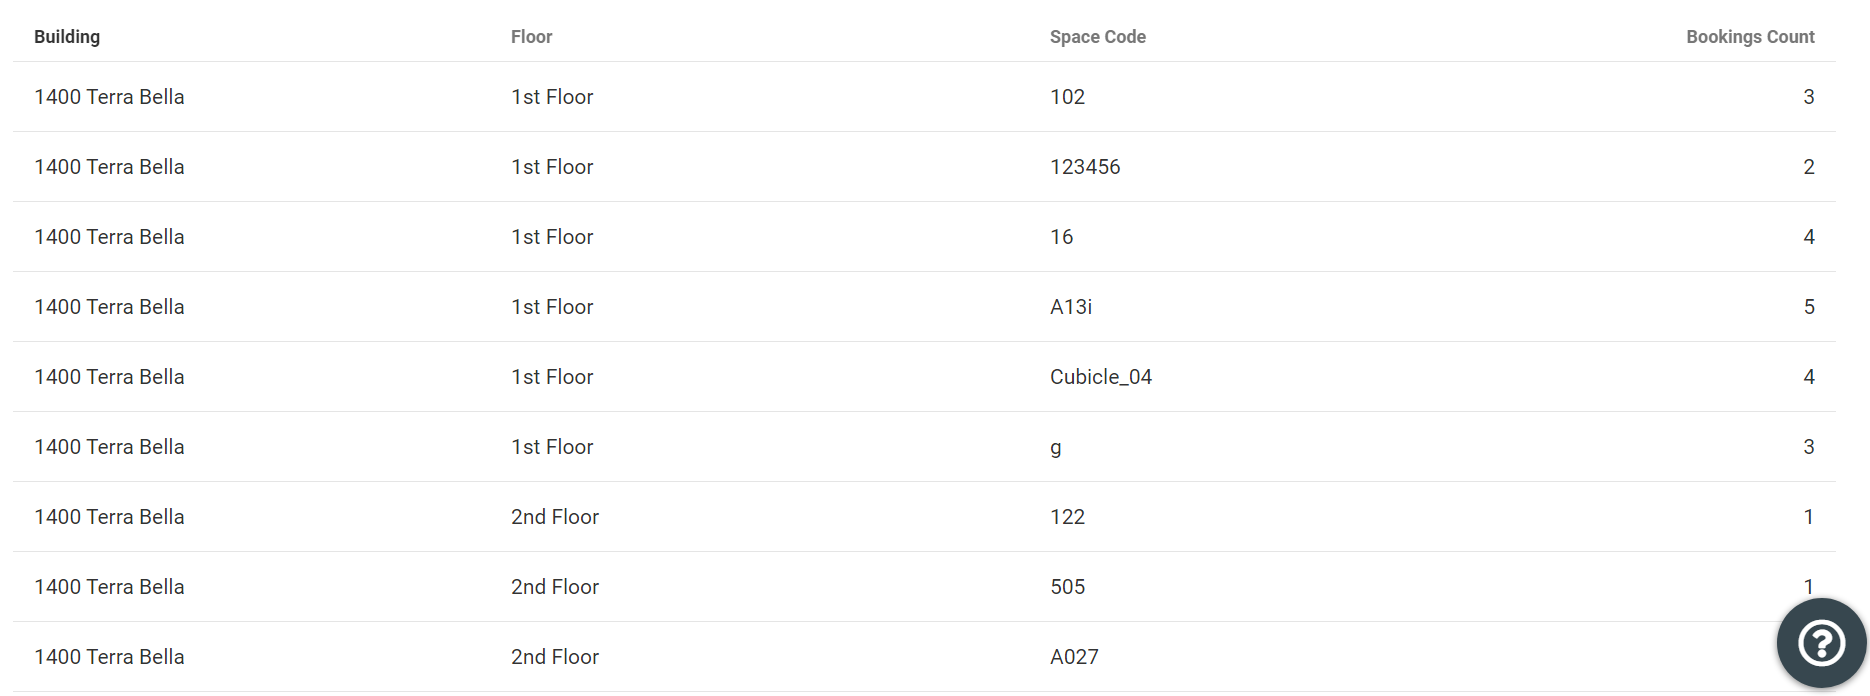
The Hotel Desk Bookings table consists of the following columns:
- Building - describes the name of the building.
- Floor - describes the name of the floor.
- Space Code - this is the Space Code assigned to each space.
- Bookings Count - this is the number of bookings.
You can sort columns by clicking on a header and then specifying ascending or descending order.
Export Data
Report data can be easily exported to a CSV file by clicking the Export icon in the report screen's top right.
If you want to export all available data, be sure that all filters have been removed; if filters are applied then the export will export filtered data.