Neighborhoods Overview Report
Purpose
The Neighborhoods Overview Report provides summary statistics about neighborhoods.
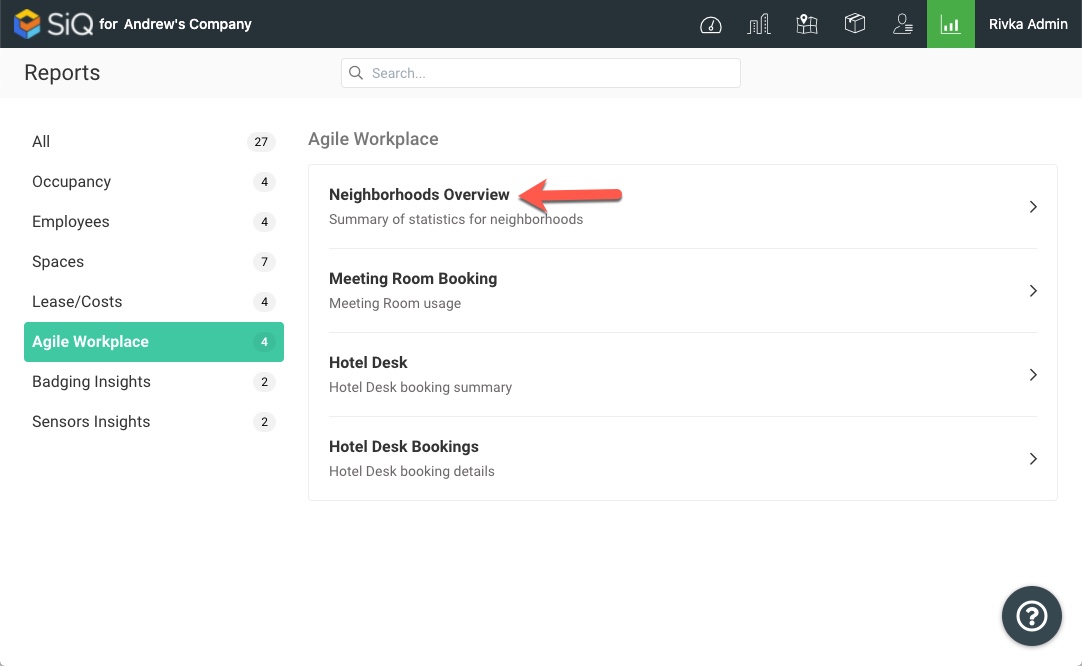
Navigate
From the top menu, click the Report icon. Then select Agile Workplace > Neighborhoods Overview.
Special Data Elements
Neighborhoods Summary Table
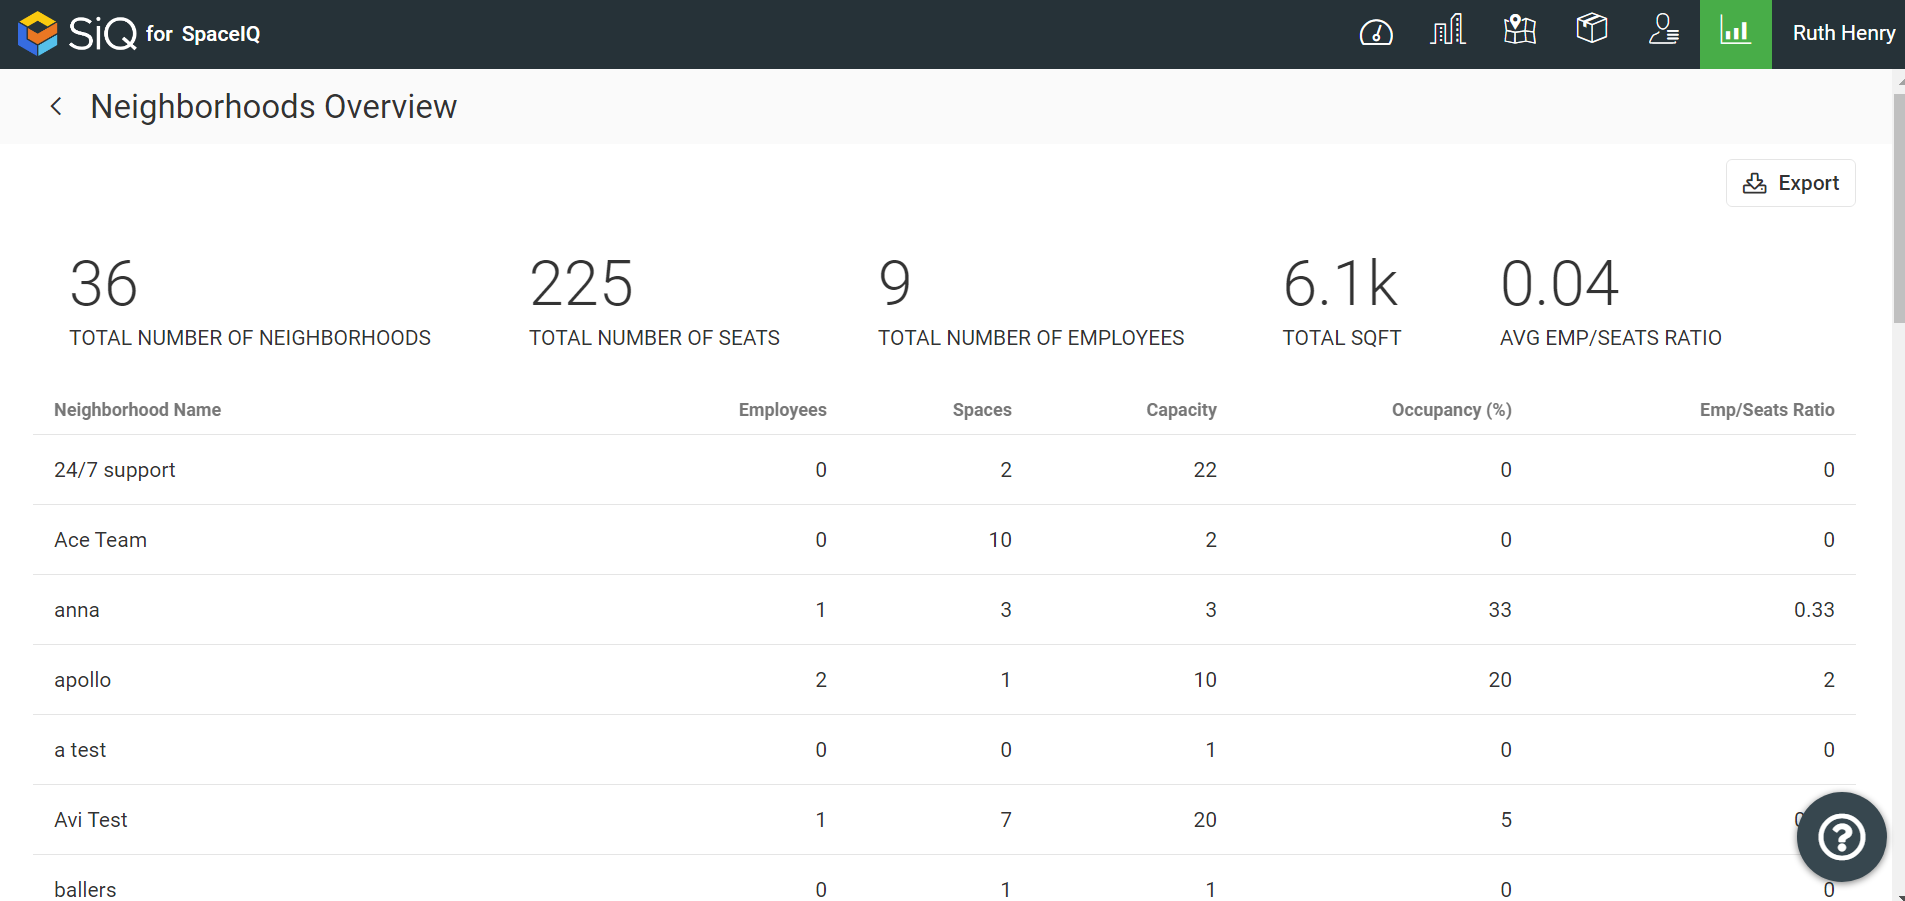
Neighborhoods Summary consists of the following columns:
| Column | Description | Type |
|---|---|---|
|
Total number of neighborhoods
|
Number of all neighborhoods that belong to the company | Number |
| Total number of seats | Number of all seats assigned to the neighborhoods | Number |
| Total number of employees | Number of all employees assigned to the neighborhoods | Number |
| Total SQFT | Total size in sqft occupied by neighborhood. Note that by default the space has 0 sqft unless the user has updated it. | Number |
| Avg employees/seats ratio | The ratio of all employees assigned to the neighborhoods to the number of all neighborhoods. Note the calculations are per seat per neighborhood. | Number |
| Neighborhood name | Name of the neighborhood | Text |
| Employees | Number of employees assigned to the neighborhood | Number |
| Spaces | Number of spaces associate to a neighborhood | Number |
| Capacity | Neighborhood capacity | Number |
| Occupancy (%) | % of neighborhood occupied | Number |
| Emp/seats ratio | The ratio of employees to seats | Number |
Sort Columns
By default, columns on the report are not sorted. To sort columns, click a header and choose to sort ascending or descending.
Export
To export report data in CSV format, click the Export icon on the top right. To export all report data, make sure all report filters are removed; if filters have been applied, the export will include only filtered data.