Live Analytics
About the Live Analytics dashboard
Live Analytics is a real-time operational dashboard that provides both real-time and recent-time views of how your personal space and meeting space resources are being used in a selected location. It provides useful insights about utilization that can help you make informed decisions around space planning to improve workplace efficiency. Read it regularly to build familiarity and make patterns easier to spot over time.

How it works - The dashboard displays personal and meeting space utilization data directly from the live database, with no data warehouse dependency - providing an accurate, on-demand view of usage. Data is retrieved via server-side SQL queries and visualized using Chart.js. It is refreshed immediately when filters are changed and can also be refreshed on the fly. Filters update all charts and metrics instantly without a full page reload.
Only charts for your enabled space types (meeting spaces and/or personal spaces) are displayed, and charts are only visible if booking data exists for the selected time frame.
The Live Status charts at the top of the dashboard show what is happening right now. These charts indicate current usage and availability of spaces, and also show the most recent check-in activity over the last hour.
- Weekly - Last week, this week, or next week.
- Daily - Yesterday, today, or tomorrow.
- Monthly - This month or last month.
Who can access the Live Analytics dashboard?
The Live Analytics dashboard is available to all customers and does not require an Eptura Engage Analytics subscription. Administrators must have access to the Reports module to view the Live Analytics dashboard, and they can only view data for the countries and locations they manage. Learn more: Administrator access levels
Contents
- Launch the Live Analytics dashboard
- Live Status data
- Recent time data
- Personal Space booking overview
- Meeting Space booking overview
- Office Occupancy
- Trends
- Popular Spaces
- Meeting Space Metrics
- Employee Metrics
- Personal Space booking source
- Meeting Space booking source
- Bookings (by selected time frame)
- Booking Behavior
- Meeting Seating Styles
- Personal Space bookings by floor
Launch the Live Analytics dashboard
The Live Analytics dashboard is launched from the Analytics module in the Eptura Engage web app.
- Sign in to the Eptura Engage web app and go to Analytics > Live Analytics from the module menu on the left.
- Select the Country and Location from the drop-down lists on the right-hand side to refresh the dashboard with the required data.

Live Status data
The Live Status charts show a snapshot of current activity across your organization.
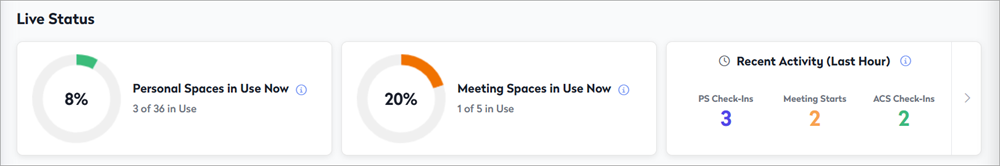
It shows at a glance:
- Personal spaces in use now - The percentage and number of personal spaces that are currently in use (checked in), compared with total capacity. Includes both all-day and hourly personal space resources. Closed spaces are excluded.
- Meeting spaces in use now - The percentage and number of meeting spaces that are currently in use (bookings that have started or are in progress) compared with total capacity. The count only increases when the booking start time is reached, even if the meeting was started earlier. Closed spaces are excluded.
- Recent activity (last hour) - Check-in activity over the last 60 minutes. This includes:
- Check-ins to personal spaces in the last hour (counted per unique booking event, not per user).
- Meeting space bookings that were started in the last hour.
- Check-ins via an integrated Access Control System (ACS) in the last hour.
Recent activity
Click the arrow on the right of the Live status charts to open the Recent Activity side panel.
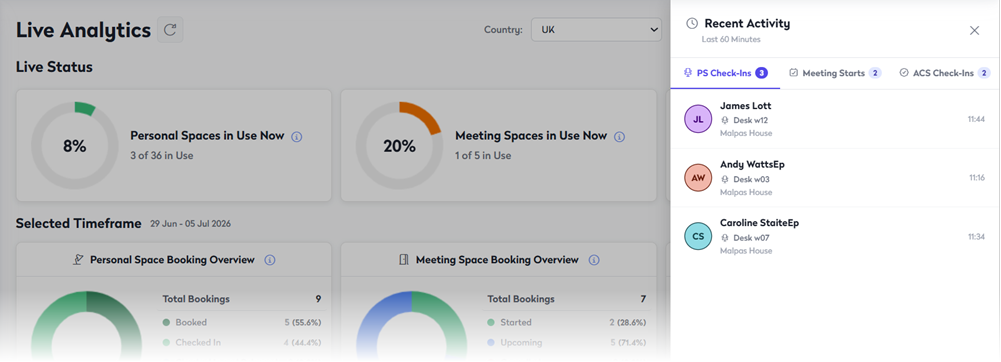
From the Recent Activity side-panel, you can review the last 60 minutes of activity for:
- PS check-ins - Displays personal space bookings that were checked in within the last 60 minutes. Shows the space name and the person the space was booked for.
- Meeting starts - Displays meeting space bookings that were started within the last 60 minutes. Shows the space name and the name of the person who created the booking (not the host).
- ACS check-ins - Displays personal space bookings that were checked in via the Access Control System (ACS) within the last 60 minutes. Shows the space name and the name of the person the space was booked for.
Recent time data
The Selected Time Frame section of the dashboard can show recent historical data. The current selection is shown in a blue box along with the date range, and you can select a different time frame from the drop-down list on the right.

Filter the charts by the following weekly, daily, or monthly time frames:
- Weekly (Mon-Fri only) - Last week, this week, or next week.
- Daily (Mon-Sun) - Yesterday, today, or tomorrow.
- Monthly - This month or last month.
Personal Space booking overview
The Personal Space booking overview chart is interactive - click a status in the legend to exclude or include the measure in the chart.

Shows the total number of personal space bookings in the selected time frame, broken down by booking status. The chart shows the actual number and percentage for the following statuses:
- Booked - booked personal spaces that have not been checked in, canceled, or bumped.
- Checked in - checked-in personal spaces, excluding bookings that were checked in and later released.
- Checked in and released - booked personal spaces that were checked in and then released.
- Canceled - personal space bookings that were deleted before the check-in window was closed.
- Bumped - personal space bookings that were automatically released (bumped) because they were not checked in within the defined check-in period.
Meeting Space booking overview
The Meeting Space booking overview chart is interactive - click a status in the legend to exclude or include the measure in the chart.
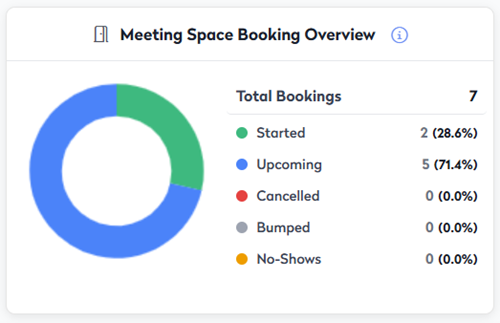
Shows the total number of meeting space bookings in the selected time frame, broken down by booking status. The chart shows the actual number and percentage for the following statuses:
- Started - meeting space bookings that were manually or automatically started.
- Upcoming - future meeting space bookings that have not yet been started, up to the end of the selected time frame. We expect this measure to be zero if the selected date range is in the past.
- Canceled - meeting space bookings that were canceled, and requests for meeting spaces rejected by an administrator before the check-in window closed.
- Bumped - meeting space bookings that were automatically released (bumped) because they were not started within the defined check-in period.
- No-shows - meeting space bookings that an administrator marked as 'no-show'.
Office Occupancy

Office Occupancy shows the number of personal space resources (regardless of type) occupied during the selected time frame.
A resource only needs to be booked once per day to be considered occupied, regardless of booking duration. For example, if an hourly personal space is booked three times on the same day, it is counted as occupied only once for that day.
Only weekday bookings (Monday-Friday) are included in the calculations.
The measures show:
- Occupancy - The number of personal space resources occupied during the selected time frame.
- Total Capacity - The maximum possible occupancy during the selected time frame. For example, in a weekly view, if there are 20 occupiable spaces available each weekday, the total capacity is calculated as 5 days × 20 spaces = 100.
- Available Spaces - The remaining capacity, calculated as Total Capacity minus Occupancy.
The donut chart indicates how occupied the workplace was over the selected time frame, based on the following measures:
- Low - less than or equal to 40% occupancy
- Medium - between 41% and 70% occupancy
- High - more than 70% occupancy
Trends

Compares key measures over the selected time frame with the previous equivalent period.
The selected time frame determines what constitutes an equivalent comparison period. For example:
- Daily view - Trending data is calculated across all days of the week (for example, Monday is compared with Sunday). Comparisons depend on the selected view:
- Today is compared with yesterday
- Tomorrow is compared with today
- Yesterday is compared with the day before
- Weekly view - Trending data is calculated for weekdays only (Monday to Friday). Comparisons are always based on a full Monday to Friday period, regardless of when the report is run. Comparisons depend on the selected view:
- This week is compared with last week
- Next week is compared with this week
- Last week is compared with the previous week
- Monthly view - Trending data includes all days in the month. Comparisons depend on the selected view:
- This month is compared with last month
- Last month is compared with the previous month
The measures show:
- Total personal space bookings - the total number of personal space bookings (including canceled bookings) over the selected time frame, showing the difference from the previous equivalent period.
- Total meeting space bookings - the total number of meeting space bookings (including canceled bookings) over the selected time frame, showing the difference from the previous equivalent period.
- Employee check-ins - the total number of personal space check-ins over the selected time frame, showing the difference from the previous equivalent period.
- Check-in rate - the percentage of check-ins compared to the number of bookings over the selected time frame, showing the difference from the previous equivalent period.
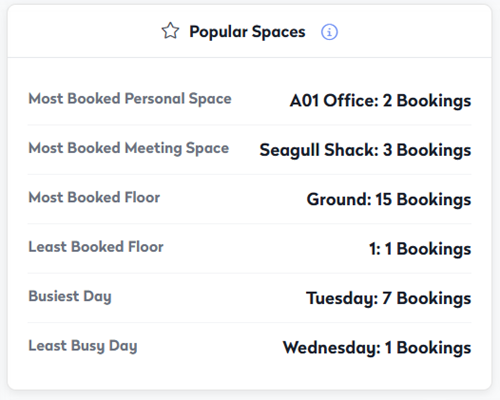
Popular Spaces
The Popular Spaces card shows highs and lows for the selected daily, weekly, or monthly time frame. The 'floor' and 'day' totals combine both personal and meeting space bookings.
|
|
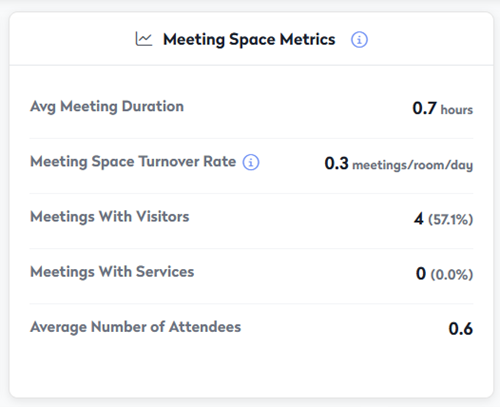
Meeting Space Metrics
The Meeting Space Metrics card shows key meeting space booking metrics for the selected time frame, including average duration, booking frequency, meetings with visitors or services, and average attendees.
|
|
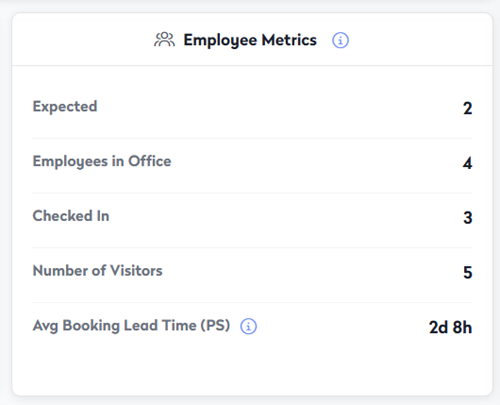
Employee Metrics
The Employee Metrics card shows the number of employees and visitors who are/were in the workplace or expected to be there, in the selected time frame. The average lead time for personal space bookings is also shown.
Employees and visitors are defined as:
- An employee is anyone with an Eptura Engage user account
- An employee is considered in the office when they have a booking for a personal space that is designated as a workspace, such as a desk or office.
- A visitor is an external guest added to the attendee list of a meeting space booking.
|
|
Personal Space Booking Source / Meeting Space Booking Source
The personal space and meeting space source charts show the distribution of bookings by booking method - via the Eptura Engage web app, mobile app, kiosk, or Microsoft Outlook, etc.
Bookings made via the Eptura Engage web app are further divided to show bookings created from the Today page or automatically created via the intelligent booking technology, for example.

Bookings are broken down into the following booking sources:
Booking source |
Personal space booking |
Meeting space booking |
| Web | Booking created using the Eptura Engage web app (but not via the Today page, which is shown as a 'Today page' booking). | Booking created using the Eptura Engage web app (but not via the booking grid, which is shown as a 'QuickBook' booking). |
| Mobile app | Booking created via the Eptura Engage mobile app. | Booking created via the Eptura Engage mobile app. |
| Outlook | n/a | Booking created via Microsoft Outlook. |
| ExchangeAddIn | n/a | Booking created via the Eptura Engage Outlook add-in. |
| ExchangeResource | n/a | Booking created by inviting Exchange room to Outlook calendar event. |
| Today Page | Booking created via the Today page on the web app. | n/a |
| QuickBook | n/a | Booking created directly on the booking grid. |
| ExternalBookingAPI | Booking created via a third-party integration. | Booking created by a third-party integration. |
| IntelligentBookingWeb | Booking created automatically when a user's status was marked as 'in-office'. | n/a |
| IntelligentBookingAdminAPI | Booking created via the Admin API by a third-party integration. | n/a |
| CondecoScreen | n/a | Booking created directly from an Eptura, Condeco, or other connected room screen device. |
| DeskScreen | Booking created directly from a Condeco Desk Screen v3 for Eptura Engage. | n/a |
| DeskKiosk | Booking created directly from an Eptura Engage desk booking kiosk | n/a |
| Sensors | Booking created via occupancy sensor. | Booking created via occupancy sensor. |
Bookings (by selected time frame)
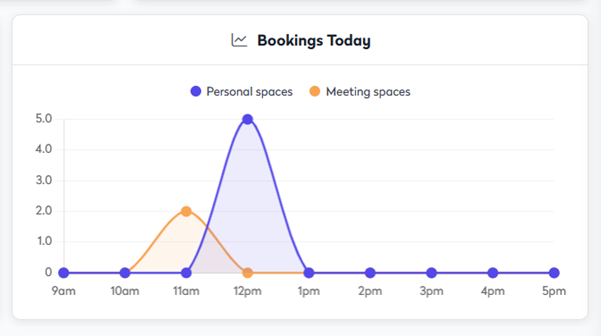
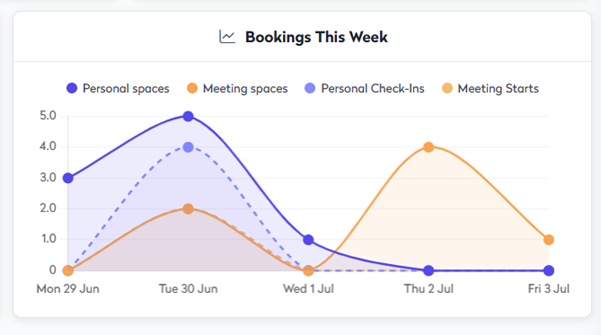
The Bookings line charts show the number of meeting and personal space bookings across the selected time frame. The weekly and monthly views also show the number of check-ins (personal spaces) and starts (meeting spaces) across the selected time frame.
Daily views
When viewing data for today, yesterday, or tomorrow, the x-axis represents the hour that bookings were expected to start (booking start time), and the y-axis shows the number of spaces booked to start during that hour.
Weekly views
When viewing data for this week, last week, or next week, the chart shows the number of weekday bookings (Mon-Fri) on each day. The dotted lines represent the number of check-ins (personal spaces) and meeting starts (meeting spaces).
Monthly views
When viewing the data for this month or last month, the x-axis represents the date, and the peaks show the number of bookings on each date. The dotted lines represent the number of check-ins (personal spaces) and meeting starts (meeting spaces).

Booking Behavior
The Booking Behavior chart shows when bookings were typically made over the selected time frame. Both personal and meeting space bookings are shown as a percentage of the total number of bookings.
- Booked ahead - Percentage of bookings made at least one day in advance.
- Same-day - Percentage of bookings made on the same day as the booking.
- Instant - Percentage of bookings made for immediate use or within one hour of the booking start time.

Meeting Seating Styles
The Meeting Seating Styles chart shows the distribution of meeting space bookings in the selected time frame by the requested seating style.

Personal Space Bookings by Floor
The Personal Space Bookings by Floor shows the number of bookings per floor in the selected time frame.
