Reports module
Contents
About the Reports module
The Eptura Engage Reports module provides both pre-defined and customizable reports that allow you to view and export comprehensive data about your organization's booking history and resources.
Reports are available for bookings, resources, users, and visitors, and can be filtered by a defined time frame, location, group, workspace type, etc.
An administrator with access to the Reports module can access Reports from the left menu. Learn more: Administrator access levels

Report types and categories
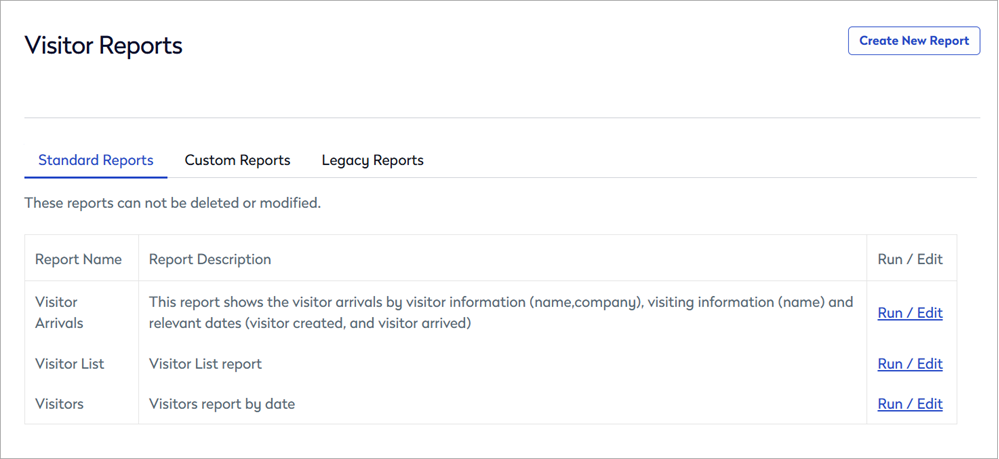
Reports can be run to gain insights about your Eptura Engage bookings, resources, visitors, and users. Standard pre-defined reports are provided, and these can be edited to suit your specific requirements and saved as a modified report.
The reports are divided into categories, and opening any category displays the Standard Reports tab, which lists all available pre-defined standard reports for that report category. When a standard report is edited and saved, it is listed under the Modified Standard Reports tab. This tab is only visible when a standard report has been edited and saved. Standard reports can be exported to Microsoft Excel (XLS) or PDF format.
You can also create reports from scratch. These reports are then listed under the Custom Reports tab. This tab is only visible when a custom report has been saved. Custom reports can be exported to Microsoft Excel (XLS) or PDF format.
Standard reports, Modified Standard reports, and Custom reports all use the Eptura Engage reporting engine, which allows you to customize the report format, filter data, add or remove data columns, and group fields.
Some report categories also include the Formatted Reports tab and Legacy Reports tab; these reports are pre-configured and cannot be customized. More details about these reports is available in the sections below.
Formatted reports and Legacy reports do not use the Eptura Engage engine; the report output is either displayed in a browser window or downloaded. These reports cannot be edited or saved.
Report categories and fields
Expand the sections to view the report categories and fields
Meeting space reports - categories and fields
Meeting space reports
Booking reports for meeting space resources.

Meeting space report fields
The following fields are available for meeting space reports:
|
General Fields
Time
|
Category
Cost
Host
|
Requestor
Booked By
Geography
|
Time Used
Item Note
Visitors
Events
Custom Fields
|
Other fields might be available.
Personal space reports - categories and fields
Personal space reports
The Personal Space Reports section includes booking reports for all-day personal space resources only. Reports for hourly personal spaces are in the Hourly reports section.

Good to know
- Desks Allocated to People report: This report initially displays all active and released bookings. To include bumped or deleted bookings, apply the Cancelled Items Only? filter. See below: Set the default filters
Personal space report fields
The following fields are available for all-day personal space reports:
|
Desk
|
Cost
Date
User
|
Geography
Department
Team days
|
Other fields might be available.
Hourly reports - categories and fields
Hourly reports
Booking reports for hourly personal space resources.

Hourly report fields
The following fields are available for hourly personal space reports:
|
Hourly
|
Date
Geography
User
|
Other fields might be available.
Resource reports - categories and fields
Resource reports
Resource reports provide detailed information about your different resource types. Resource types include personal spaces, meeting spaces, delivery points, catering, equipment, supplies.

Resource fields
The following fields are available for resource reports:
|
Resource
|
|
Other fields might be available.
User reports - categories and fields
User reports
User reports provide detailed information about your Eptura Engage users.

User fields
The following fields are available for user reports:
|
User
|
|
Other fields might be available.
Visitor reports - categories and fields
Visitor reports
Visitor reports include detailed information about visitors added to bookings and visitors and visits added via the Visitors module.
Visitor report fields
The following fields are available for Visitor reports:
|
General Fields
Notification
Date
|
Visitor
|
Visit
Visiting
|
Other fields might be available.
Run and edit a standard report
Standard reports and Modified Standard reports use the Eptura Engage reporting engine, which allows you to customize the report format, filter data, and add or remove data columns. Standard reports that have been edited and saved, are listed on the Modified Standard reports tab, which is only shown when at least one modified standard report has been saved.
- Sign into Eptura Engage as an Admin with access to the Reports module.
- Select Reports from the left menu.
- Click View Reports / Create New for the type of report you want to run. Learn more: Report types and categories
- A list of standard reports is displayed. Click Run / Edit to run a report.
- The selected standard report is displayed.

The report can be sorted alphabetically by any displayed field. Click the field names above the columns to sort by that field. Drag columns left and right to change the order, and drag the column dividers to increase or decrease the column size.
Various filters and customizations are possible:
- Set the default filters (A and C)
- Add and remove columns (B - Show Field Selection Window)
- Group data by field (B and D)
- Filter column data and add conditions (E)
- Create a filter using the Filter Builder (F)
See also:
Set the default filters (A and C)
Show image
The report shows data for the displayed location and time period (A). By default, all countries are selected and the report includes data for all locations, groups, and resource types. To select specific locations, groups, or resource types (defined as 'Services' in the filters), or change the time period, click Change Filters (C) from the action buttons (G).
Change Filters (C)
Show image
- Click Change Filters (C) from the action buttons.
- Click the down arrows to make your location and group selections from the drop-down lists.
Note that the Region, Location, Floor, and Group, lists are reliant on a selection being made from the options above, so the list will be empty if the option(s) above is not selected. If no specific selection is made, then the report shows all data for that option and the options below it.
The Services list (resource types) is reliant on a Country, Region, and Location being selected.
- Select from the following options:
- Country
- Region
- Location
- Floor
- Group
- Services (resource types, such as All-day personal space resources, hourly personal space resources, and meeting space resources. Note that the 'Parking' option relates to a legacy 'parking module' that is no longer in use).

- Select a defined time period from the list, or select Specific at the bottom of the Time Period list to enter a particular start and end date for the report.

- When you've made your selections, click Refresh Data to reload the report.
Add and remove columns
Click Show field selection window (B) action button to add and remove field columns from the report. Tick Add for the fields to show in the report.
From here, you can also group fields and show group and total calculations for numeric fields. Learn more: Group data by columns
Filter column data and add conditions (E)
Show image
The report can be filtered by column, or by defined conditions such as 'begins with' and 'equals' etc. The available conditions depend on whether the field is alpha or numeric.
To filter by column, click the filter icon to the right of the field name above the column, and select a value from the list. Alternatively, you can enter all or part of the value to find matching entries.

To filter by condition, enter the conditional value in the box under the field name, and click the filter icon to the right to reveal and select the condition to apply to the value. The condition options depend on whether the field is alpha or numeric.

The report is dynamic, so the results are automatically updated according to the filter and/or conditions selected.
You can continue to add more filters and conditions either via the filters at the top of the columns, or by using the Filter Builder. Learn more: Create a filter using the Filter Builder
Create a filter using the Filter Builder (F)
Show image
The Filter Builder allows you to create a series of rules to build a more complex report quickly. If you have already filtered by column and/or added conditions to the fields, those rules are already added to the Filter Builder.
To start the Filter Builder, click Create Filter (F) at the bottom of the report. If you have already added filters/conditions, the current rules appear as a link in place of 'Create Filter'.

The Filter Builder opens and shows any filters and conditions already added. Follow the steps to build the filter and refer to the numbered images below.
- Click And to select a rule argument, then click the plus icon ( + ) to add the rule to the filter. The first field (alphabetically) is automatically added to the builder.
- To change the field, click the field name to show the list. Select the required field from the alphabetical list.
- Click the condition to select the required condition from the list.
- Click <enter a value> to type a value for the condition.
- Continue to add rules as required, and click OK to run the report and display the results.

Filter Builder steps
Group data by field (B and D)
Show image
Fields can be grouped after generating a report, either by dragging a column heading to the area above the report (D), or via the 'Show Field Selection Window' (B) action button, which also provides options for calculating group averages, totals, quantities, etc. for cost and time duration fields. When grouping is applied, use the Expand All and Collapse All action buttons (G) to view the required data.

Group fields by dragging columns (B)
Show image
Drag a column heading to the area above the report to group data by that field. You can continue to drag columns to the top to create sub-groups.

This is the easiest and quickest way to group fields, but if the report contains lots of columns, it can be easier to select the fields from the 'Field Selection' window, accessed via the Show Field Selection Window (D) action button. Learn more: Show Field Selection Window
Show Field Selection Window (D)
Show image
Fields can be added and grouped from a field selection window. The field selection window also provides options for group calculations for cost and time duration fields, such as group totals and averages, quantity counts, maximum and minimum calculations.
Hover over any underlined item in the Field Selection window to learn more about the field or function. Note, these are tips only; they are not clickable links.
- Click Show Field Selection Window from the action buttons (G) above the report.
- Tick the Add box for the fields to include in the report.
- Tick the Group box for the field you want to group and click Modify at the bottom of the list to create the grouping.
- To add a sub-group, tick the Group box for the next field and click Modify to add the sub-group.
Make sure to click 'Modify' after selecting each field to organize the sub-groupings, otherwise the primary and secondary groups will be added in the order they appear on the list, which might not result in the desired outcome.
- To add group calculations, select the calculations to show; Sum, Average, Count, Max, Min. Options are only shown where the calculation is possible.

- Click Modify when done, and click the X at the top right to close the field selection window and refresh the report.
The selected calculations are shown in brackets after the field name.

Action buttons

Save As
When you have edited the filters and customized a standard report, you can save it for future use.
Enter a name for the report and a description, then click Save changes. Saved reports are listed on the 'Modified Standard Reports' tab.
Show Field Selection Window
From the 'Show Field Selection Window', you can add and remove columns from the report, group data by fields, and show cost and time duration calculations, such as group totals and averages, quantity counts, etc.
Learn more:
Change Filters
Select the default locations, groups, resource types, and time period, to display for the report.
Learn more: Set the default filters
Expand All and Collapse All
If grouping is applied, use Expand All and Collapse All buttons as appropriate to view the required data.
Learn more: Group data by field
Export to Excel
Click Export To Excel to download the report in XLS format. The file is saved to the default download folder on your device and is named [ReportName]-export-[dd-mm-yyyy].XLS
Export to PDF
Click Export To PDF to download the report in PDF format. The file is saved to the default download folder on your device and is named [ReportName]-export-[dd-mm-yyyy].PDF
Create a custom report
Create a customized report from scratch using the New Report Wizard. The wizard can be started from the Reports module or from a report category (meeting spaces, personal spaces, etc.). When started from a report category, the wizard jumps straight to step 6 below.
Custom reports only show the current booking status of resources. This means that when you generate custom reports, only the most recent booking status for each resource is shown.
- Sign into Eptura Engage as an Admin with access to the Reports module.
- Select Reports from the left menu.
- To start the wizard, click the Create New Report button at the top right of the Reports module.

- Click Select for the type of report you want to create (meeting space reports, personal space reports, etc.) and click Next.
- Click Select next to Custom Reports (there are no other options available). Click Next.
- Select the fields, groupings, and calculations, as required, and click Next. Learn more: Show Field Selection Window Note, you might get an error if you select a calculation without also selecting the Group option for that field.
- Enter a name and description for the report and click Finish.
The new report is saved to the Custom Reports tab for the report category.
Formatted reports
Formatting reports are available for Meeting spaces and Users. They are pre-configured and cannot be customized. Most formatted reports are displayed in a web browser and might include an option to export to Microsoft Excel, while some are directly exported to a Microsoft Excel XLS file when run.
Where formatted reports exist, they are listed on the Formatted Reports tab for the report category.
To run a formatted report, click Run and select the Country and Time Period for the report (the available filters depend on the report). When you've selected your filters, click Run Report.

The formatted report is either opened in a new web browser tab or is exported to a Microsoft Excel XLS file.
Reports that are displayed in a web browser might include an Export to Excel link at the top right of the report.

Reports exported to a Microsoft Excel XLS file are saved to your default download folder.
Legacy reports
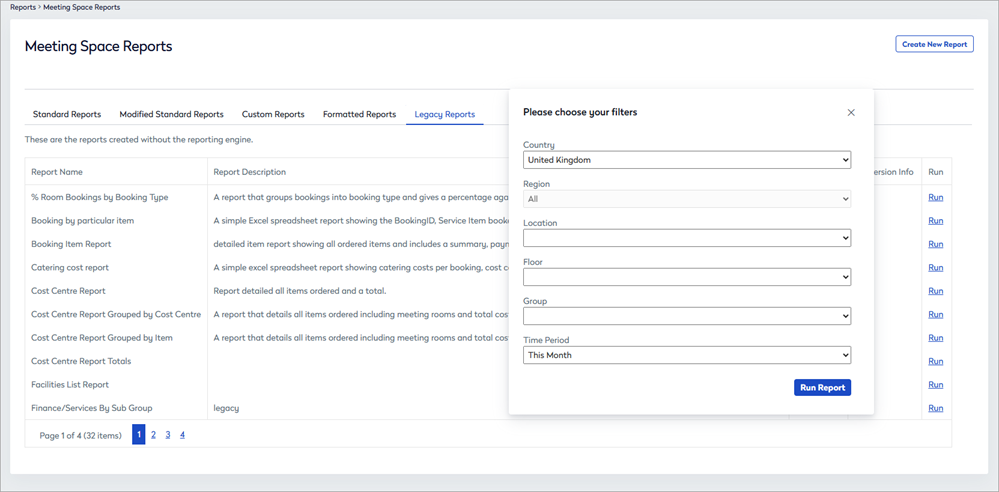
Legacy reports are available for Meeting spaces, Personal spaces (all-day), Visitors, and Users. They are pre-configured and cannot be customized. Depending on the report, the output might be displayed in a web browser tab or exported to a Microsoft Excel XLS file.
Where legacy reports exist, they are listed on the Legacy Reports tab for the report category.
To run a legacy report, click Run and select the Country and Time Period for the report (the available filters depend on the report). When you've selected your filters, click Run Report.
Depending on the report, the output is either displayed in a web browser tab or exported to a Microsoft Excel XLS file and saved to your default download folder.