Understand the Inspections KPIs
The Key Performance Indicators (KPIs) gives you a quick, at-a-glance, view of how the Inspections are doing.
Watch the Video
Audio: Sound Length: 1:33 mins
Learn more
- Navigate to Inspections.
- Click the Show KPI
 icon.
icon.
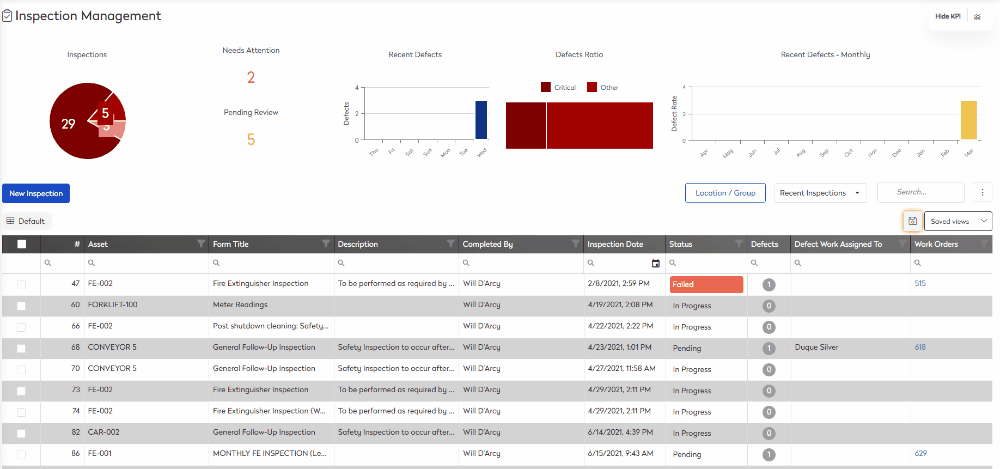
Going across the top of the screen, the following dynamic tools are:
- Inspections - This shows you the number of inspections in progress, pending, and failed. Click on the segment to display the relevant inspections.
- Needs Attention - This shows the number of inspections that need attention.
- Pending Review - This shows the number of inspections that are pending review.
- Recent Defects - This is the weekly graph of the recent defects.
- Defects Ratio - This is the graph of the defects ratio, for example, Critical and Other.
- Recent Defects - This is the graph of the monthly recent defects. Click on the month's bar to see the defects for the month. To return to the monthly view, click the graph.
- Click on any of the KPI graphs, it will display the relevant inspections in the list.
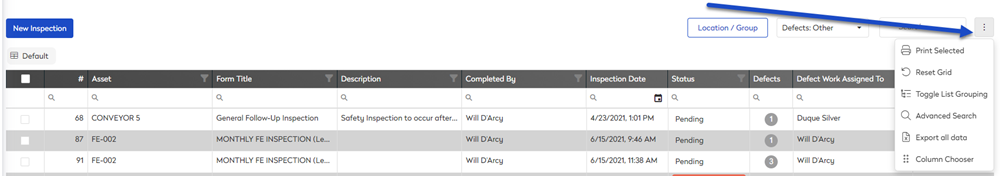
You can reset the view, click the More Actions  icon, and then Reset Grid.