Working Styles
The Working Styles canvas provides visual insights into the distribution of presence in the workplace, meeting space usage, and average booking trends.
Employees are categorized as Home, Club, or Hub workers, based on the average number of days per week they attended the workplace over the defined date range. Calculations are based on a 5-day week, either Mon-Fri or Sun-Thu, as selected in the filter.
Only users who's working status was set to 'in the office' or 'working remotely' on at least one occasion over the selected time frame are included in the stats. Users who consistently worked remotely or were not working over the time frame, are not included.
Worker categories:
- Home: Employees attending the workplace less than 2 days a week. (To be counted, they must have attended the workplace at least once in the selected time frame).
- Club: Employees attending the workplace 2-3 days a week.
- Hub: Employees attending the workplace 4-5 days a week.
To open the canvas, navigate to Analytics > Workforce & Attendance from the module menu on the left and select the Working Styles tab at the bottom of the screen.

Good to know
- Employees' in-office statuses define if they worked remotely, in the workplace, or did not work.
- Employees are only included in the stats if their working status was set to 'in the office' or 'working remotely' on at least one occasion over the selected time frame.
- The KPIs use a fixed number of 5 working days a week, either Mon-Fri or Sun-Thu as selected in the filter.
Filters (A-D)
Use the filters on the Working Styles canvases to analyze data by date range, location, and your selected 5-day working week - Mon-Fri / Sun-Thu. Changing any filters dynamically updates the visualizations on all Working Styles canvases.
- Weekdays (A): Select your typical 5-day working week. Either Mon-Fri or Sun-Thu.
- Date Range (B): Select the date range to display.
- Country, Region, Location (C): Filter the data by individual or multiple Countries, Regions, and Locations.
- Department (D): Filter the data by individual or multiple Departments.
Categories - Home, Club, Hub (E)
The information bar across the top shows the number and percentage of employees who are considered 'home', 'club', or 'hub' workers over the time frame.
The percentages are the number of 'home', 'club', or 'hub' workers divided by the total number of employees working (remotely or in the workplace) over the selected time frame.
- Home: The number and percentage of employees who worked remotely for 4-5 days out of 5 over the total number of days in the time frame.
- Club: The number and percentage of employees who worked remotely for 2-3 days out of 5 over the total number of days in the time frame.
- Hub: The number and percentage of employees who worked remotely for 0-1 days out of 5 over the total number of days in the time frame.
In-Office Peak and In-Office Average (F)
- Peak: The highest percentage of employees in the workplace on any one day over the time frame.
- Average: The average percentage of employees in the workplace over the time frame.
Visualizations (G-H)
The x-axis for both charts represents the following 'Days Range' category for the number of days in the workplace:
- 1 to 5 (days in the workplace)
- 6 to 15
- 16 to 30
- 31 to 45
- 46 to 90
- 91 to 120
- 121 to 180
- >180 (days in the workplace)
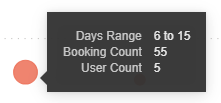
Employees by Days in Office and Meeting Space Bookings (G): The number of meeting space bookings created by employees who are in the workplace on the day of the booking, grouped in the Days Range categories. The bubble size reflects the number of unique users in the Days Range category. Hover over the bubbles to display the Days Range, Booking Count, and User Count.
Average #Meeting Space Bookings by #Days in Office (H): The average number of meeting space bookings attended by employees in the office, grouped by the Days Range categories.