Meeting Space Bookings
The Meeting Space Bookings canvas shows an overview of all meeting space bookings and specific curated metrics to understand usage relative to meeting space capacities, and how users engage with the booking applications and tools.
To open the canvas, go to Analytics > Utilization & Trends from the module menu on the left and select the Meeting Space Bookings tab at the bottom of the screen.
Use the filters at the top to show the visualizations and data by location, group, type of resource and/or workspace type, and by time frame. Learn more: Dashboard filters
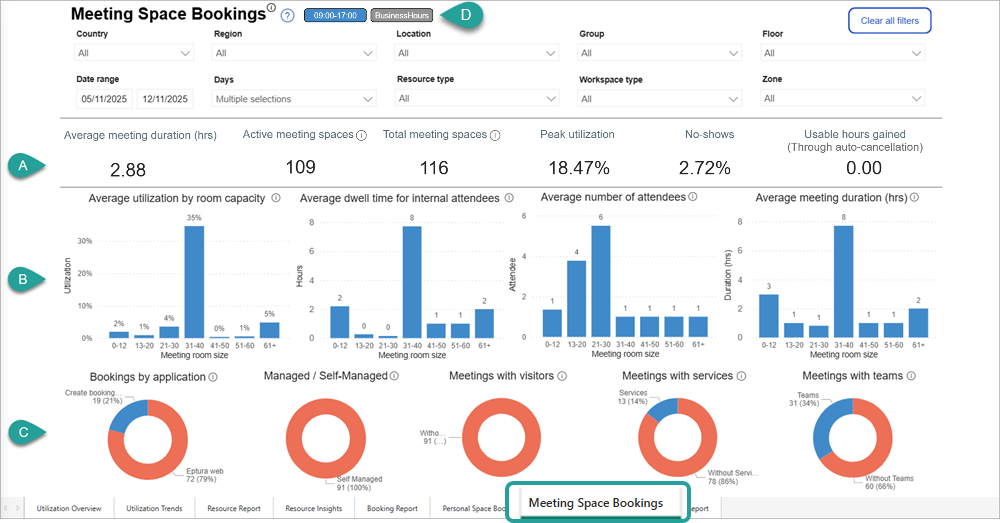
Toggle the buttons at the top (D) to include all activity during the business hours as defined in Group admin, or only activity between the hours of 09:00-17:00 (Mon-Sun).

The information bar across the top (A) shows at a glance your employees booking behaviors, and the effect this had on your resources over the selected time frame, unless otherwise noted.
- Average meeting duration (hrs): The average number of hours meeting spaces are booked over the selected time frame, by the capacity of the space as selected on the booking form. The calculation is Total meeting duration / total number of bookings.
- Active meeting spaces: The total number of meeting space resources in Eptura Engage, excluding closed and deleted resources. Note: this is the overall total and is not related to the selected date range.
- Total meeting spaces: The total number of meeting space resources in Eptura Engage, including closed and deleted resources, to ensure the accuracy of historical data. Note: this is the overall total and is not related to the selected date range.
- Peak utilization: The highest percentage of meeting space resources in use on any one day over the selected time frame.
- No-shows: The percentage of bookings that were not checked in over the selected time frame.
- Usable hours gained (through auto-cancellations): The number of bookable hours regained when bookings were automatically canceled due to no-shows, over the selected time frame
The visualizations on the top row (B) show utilization-related metrics for meeting space bookings over the time frame:
- Average utilization by meeting space capacity: The average usage of meeting spaces by the capacity of the space as selected on the booking form. Any range with no data is omitted from the graph.
- Average dwell time (hrs): The average number of hours meeting spaces are occupied, by the capacity of the space as selected on the booking form. Note - Occupancy ceases after a booking is checked out.
- Average number of attendees: The average number of meeting attendees by meeting space capacity as selected on the booking form.
- Average meeting duration (mins): The average number of minutes that meeting spaces are booked for, by the capacity of the space as selected on the booking form.
The visualizations on the bottom row (C) dive deeper into the type of bookings, internal vs external attendees, bookings with service requests, and bookings with a Microsoft Teams meeting enabled, over the selected time frame.
- Bookings by application: Shows which applications and tools users are engaging with to make meeting space bookings.
- Managed/self-managed: Compares the percentage of managed (approval required) and self-managed (bookable immediately) meeting space bookings.
- Meetings with visitors: Compares the percentage of meeting space bookings that include external visitors on the attendee list with those that only include internal attendees.
- Meetings with services: Compares the percentage of meeting space bookings that requested additional services with those that did not.
- Microsoft Teams meetings: Compares the percentage of meeting space bookings with Microsoft Teams enabled and those without.
Good to know
- Deleted meeting space resources are included to ensure the accuracy of historical data.