Personal Space Bookings
The Personal Space Bookings canvas shows an overview of all personal space bookings and specific curated metrics to understand attendance and engagement.
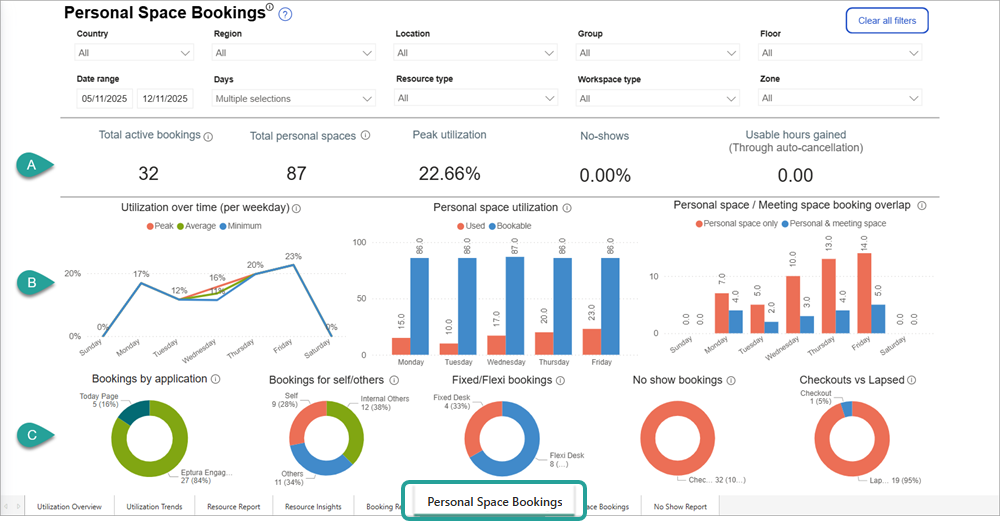
To open the canvas, navigate to Analytics > Utilization & Trends from the module menu on the left and select the Personal Space Bookings tab at the bottom of the screen.
Use the filters at the top to show the visualizations and data by location, group, type of resource and/or workspace type, and by time frame. Learn more: Dashboard filters
The information bar across the top (A) shows at a glance your employees booking behaviors and the effect this had on your resources, over the selected time frame.
- Total active bookings: Shows only active personal space bookings. Excludes canceled, deleted, and released fixed/flexi desk bookings (unless checked in before release).
- Total personal spaces: The total number of personal spaces, including closed spaces.
- Peak utilization: The highest percentage of personal space resources in use on any one day over the time frame.
- No-shows: The percentage of bookings that were not checked in over the time frame.
- Usable hours gained (through auto-cancellations): The number of bookable hours regained when bookings were automatically bumped due to no-shows.
The visualizations on the top row (B) show utilization-related metrics for personal space bookings over the time frame:
- Utilization over time (per weekday): The trends in overall resource usage per weekday are shown as an average* for the selected time frame in a line graph. The least, average, and peak usage per weekday are indicated.
- Personal space utilization: The average* number of personal spaces per weekday booked or available to book in the time frame.
- Personal / meeting space booking overlap: This shows the average* number of personal space bookings that are independent of a meeting space booking and the average number that overlap - meaning a user has a personal space booking and is also either the organizer of a meeting or listed as an attendee on the booking form.
*For example, if a 6-month time frame is selected, the 'Monday' value reflects the average usage across all Mondays in the 6-month period.
The visualizations on the bottom row (C) dive deeper into the type of bookings, who bookings are made for, how employees engage with the platform to make bookings, and whether users are checking in and checking out, over the selected time frame.
- Bookings by application: This pie chart shows which applications and tools users are engaging with to make personal space bookings.
- Bookings for self/others: Shows a breakdown of who personal space bookings were made for - either self, colleagues, or external visitors.
- Fixed/flexi bookings: Shows the usage of assigned personal spaces over the time frame - fixed (permanent) vs flexi (must check-in) personal spaces.
- No-show bookings: The percentage of personal space bookings that were checked in compared to the number of no-shows/bumps.
- Checked out vs lapsed: The percentage of personal space bookings that were checked out compared to those that were not.
Good to know
- A personal space is defined as 'in use' when it is booked.
- On the Personal Space Bookings report, an employee is defined as in the workplace when they have a personal space booking.
- Deleted personal space resources are included to ensure the accuracy of historical data.