KPI Dashboard: Quick and Easy Way to See the Efficiency Big Picture
The KPI Dashboard provides key performance indicators for your operations. With just a few clicks, easy-to-read graphics give you an overview of how your company as a whole is performing. Need to drill down a bit? You can also look at facilities individually. In this article, we're going to cover how the KPI Dashboard helps you make important decisions and achieve maintenance goals.
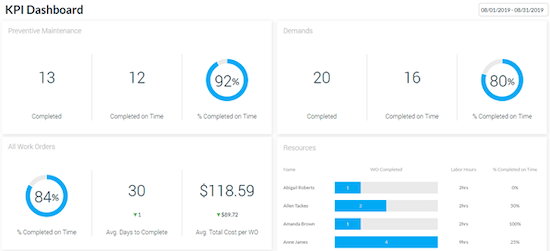
Overall Performance
You're in the middle of a busy month and need to check if you're on target for PMs and Demand work orders. Select a time period, and the KPI Dashboard shows the completion rates. By default, the KPI Dashboard shows progress for the current month as well as a comparison of average days to complete and average total cost for all work orders.
Expert Tip: Always update your work order status. If a work order is in progress, but you are waiting for an invoice or quote, keeping the status up to date avoids unnecessary overdue work orders that negatively affect your KPIs.
Resource Performance
Now that you know your overall performance, you can break it down to see how each Resource is performing, including how many work orders were completed, total labor hours, and completion rates.
Expert Tip: Make sure Resources are keeping track and updating the number of hours they spend on each work order. Labor hours in Hippo are in decimal format, so if a Resource needed one and a half hours to complete a work order, 1.5 should be logged before closing out.
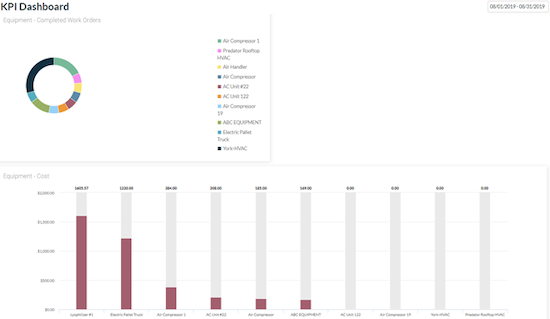
Equipment Work Orders and Costs
Ever wondered if it was better to fix a piece of equipment or replace it? The KPI Dashboard shows how often a piece of equipment required maintenance and how much it costs to keep it running. You can quickly switch to a custom time period or one of our presets (Past Month or Year to Date) to identify trends and make informed decisions. If you keep labor costs and spare parts costs up to date, KPIs make your decision easier by showing how much was spent on any piece of equipment over time.
Expert Tip: It's important to always update labor and spare parts costs. They're the main data points used to calculate the costs for each piece of equipment. If you keep track of equipment downtime, the KPI Dashboard also shows you how much time each piece of equipment was down for a selected time period.
Don't hesitate to contact us if you have any questions or if you'd like to learn more about your KPI Dashboard.