Analytics
Watch the Video
Audio: Sound Length: 0:40 seconds
About the Analytics Dashboard
The Analytics Dashboard allows you to track and measure visitor activity at a glance. You can discover trends and find out..
- How busy your reception is.
- How many guests visit per month.
- Which hosts have pre-registered visitors.
- Who hosts the most visits.
- What your peak times are, allowing you to increase staffing accordingly.
- About seasonality and get the monthly breakdown of visitor status, enabling better planning.
- If you need to increase your pre-registration efforts to provide a better visitor experience.
- If you need to make adjustments for hosts that handle an unusually high volume of check-ins.
You can also export or print all visits from the Visitor logbook. Learn more: Visitor logbook overview
View the Analytics Dashboard
The dashboard lets you view the statistics for different locations for a defined date range.
- From the menu, click Analytics.
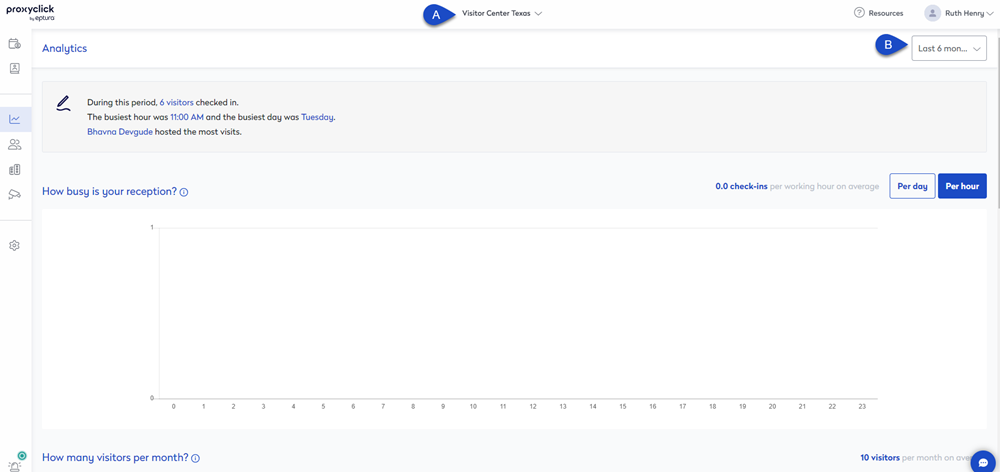
- Switch to a different location or view a building (A): Click the location drop-down and select the location or building to view the Visitor logbook. Learn more: Locations and Buildings
- Change the date range (B): Set the dashboard to show data for either Last week, Last 30 days, Last 6 months, or a set a Custom period.