Analytics
Watch the Video
Learn about the Analytics dashboard.
Audio: Sound Length: 0:42 mins
Here you will be able to track and measure visitors and at a glance, you can get quick, actionable answers to the top questions that any Front-desk team or Facility Manager wants to know. Find out and learn more about:
- how busy is your reception
- how many visitors per month
- which hosts pre-registered visitors
- who hosts the most visits
- what your peak times are and increase staffing accordingly
- about seasonality and get the monthly breakdown of visitor status so you can plan better
- if you need to increase your pre-registration efforts for a better visitor experience
- if you need to make adjustments for hosts that handle an unusually high volume of check-ins
Additionally, you can either export or print your Visitor Logbook as a report.
View the Analytics Dashboard
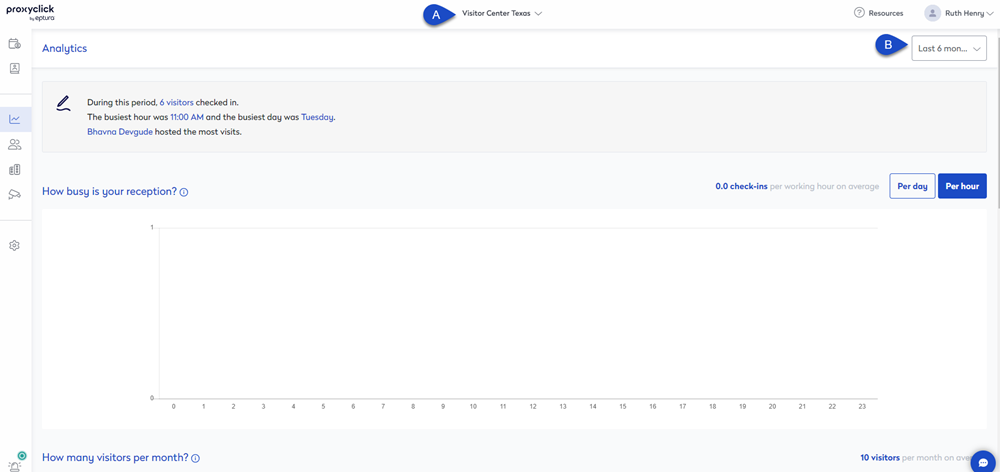
The dashboard lets you view the statistics for different locations and you can change the reporting period.
- From the menu, click Analytics.

- Switch buildings (A) to view a different location. Click the location drop-down and then click the location you want to switch to.
If you want to manage your locations, then head over to Locations Overview.
- Change the reporting period (B) to Last week, Last 30 days, Last 6 months, or a Custom period.
