328 Utilization - Space Type Summary
Overview
This report is found on the Reports Dashboard.
This report compares utilization statistics of up to 5 different space types over time. Only utilization sources specific to an individual space (such as SVLive Wired) will be used; sources like SVLive Wi-Fi and Badge Swipe, which cannot identify which specific space was used, will be excluded.
Key Data
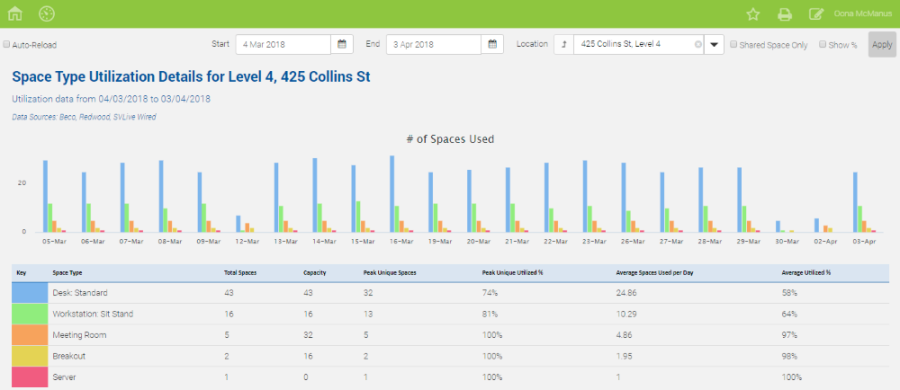
- By default, the chart will display the number of spaces of each space type that were used on each day of the chosen date range.
- If you select the Show % check box, the chart will display this number as a % of total spaces of that space type on the floor or building. This may make it easier to compare the popularity of different space types.
- The table below the chart serves as a legend for the chart. It also adds useful information about each space type, including: Total Spaces (on the chosen floor or building), Capacity (this will be Total Workpoints for desks, or Seats for meeting rooms), Peak Unique Spaces, Peak Unique Utilized %, Average Space Used per Day and Average Utilized %.
- By default, the report will display the five space types on the chosen building or floor that have the highest number of utilized spaces for the date range.
- If you select the Shared Spaces Only check box, the report will show the top 5 "shared Spaces"; these are space types that default to "Do not allow occupants".
- If run from the Reports module, you can choose the space types to view. This option is not available if you are viewing the report in the Reporting Dashboard.
- If you want to print this report, we recommend choosing PDF export in Landscape mode. It can also be printed to Excel if this is preferred.