Reports - Current/History/Inventory
This article is divided into three parts.
This article shows a User how to run reports for Current Work Orders. Current Work Order Reports are intended to report on open work orders. Work Orders with status “Not Started”, “On Hold”, “Waiting for Parts”, “Overdue”, “In Progress”, “Waiting for Quote”, “Waiting for Invoice” or “Pending Review” are considered open work orders. A User can run a report on Current Work Orders at the Enterprise Level or Facility Level. When a User runs a report from the enterprise level, he/she can report on all facilities at once. When a User runs a report from the facility level, he/she will only report on data from that facility. Enterprise Reports allow a User to compare data from one facility to another whereas Facility level reports give a User a more detailed report for one facility.
Definitions
Show Graphs: Show Graphs will display the Summary graph and the Status graph.
Show Summary/Details: Show Summary/Details allow a user to choose if he/she just wants a summary of just the details.
Work Order Type: Work Order Type allows users to choose to display Equipment, Location or Vehicle based work orders.
Instructions
- To run a report, access the Reports panel at Enterprise Level or Facility Level
- Click on the “Current Work Orders” tab. If the report is run at the facility level, a User can filter through floor plans and locations whereas the report at Enterprise Level will provide information per facility.
- Apply the filters to the report as required.
- To see summary and status graphs on a report, check off Show Graphs.
- Select Summary or Details from the dropdown or choose “All” to see both summary as well as details in the report.
- Click in the dropdown menu of Work Order Type to select Equipment, Location or Vehicle or select “All” to see a report on the work order for all three types.
- Click in the Demand/PM dropdown menu to filter through Demands or PMs or select “All” to see a report on both PMs and Demand Work Orders.
- Check off the boxes in the other fields to apply filters as required.
- If nothing is selected in the filter boxes, the report will automatically select everything.
- Make use of the Due Date Range and Generated Range fields to filter a report through a certain time period.
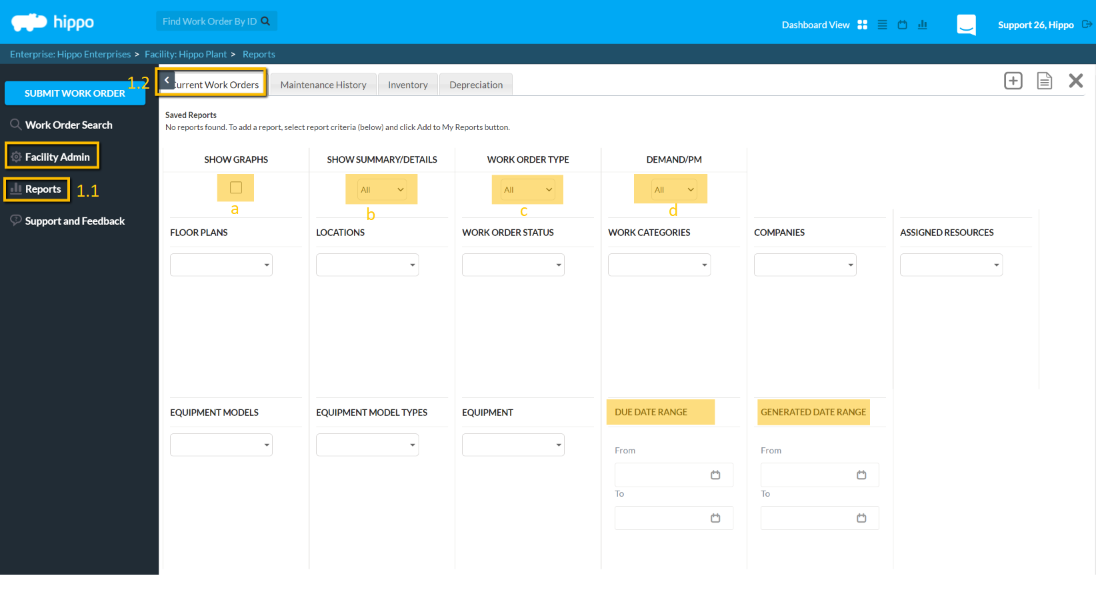
- Once all the filters have been applied, click on the “Generate Report” icon located in the top right corner and a report will pop up in the new window.

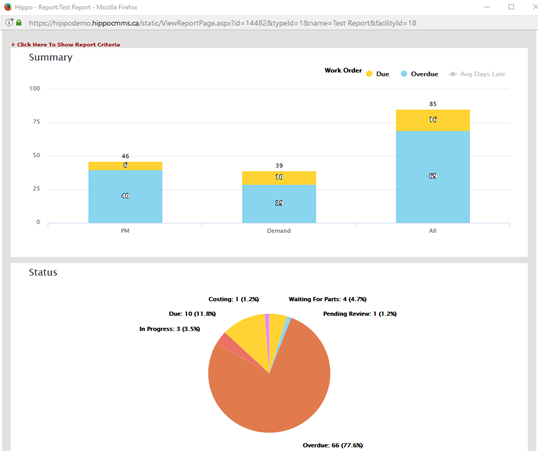
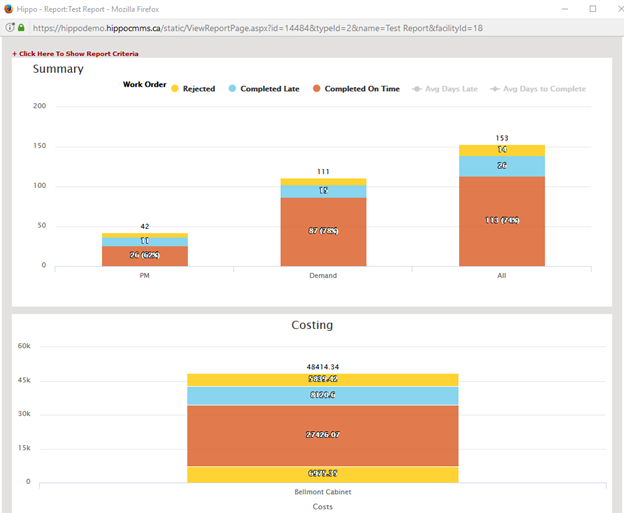
- If “Show Graphs” is checked off, a User will see the graphs at the top of the generated report. The graphs give a summary of the status of work orders as well as costs.
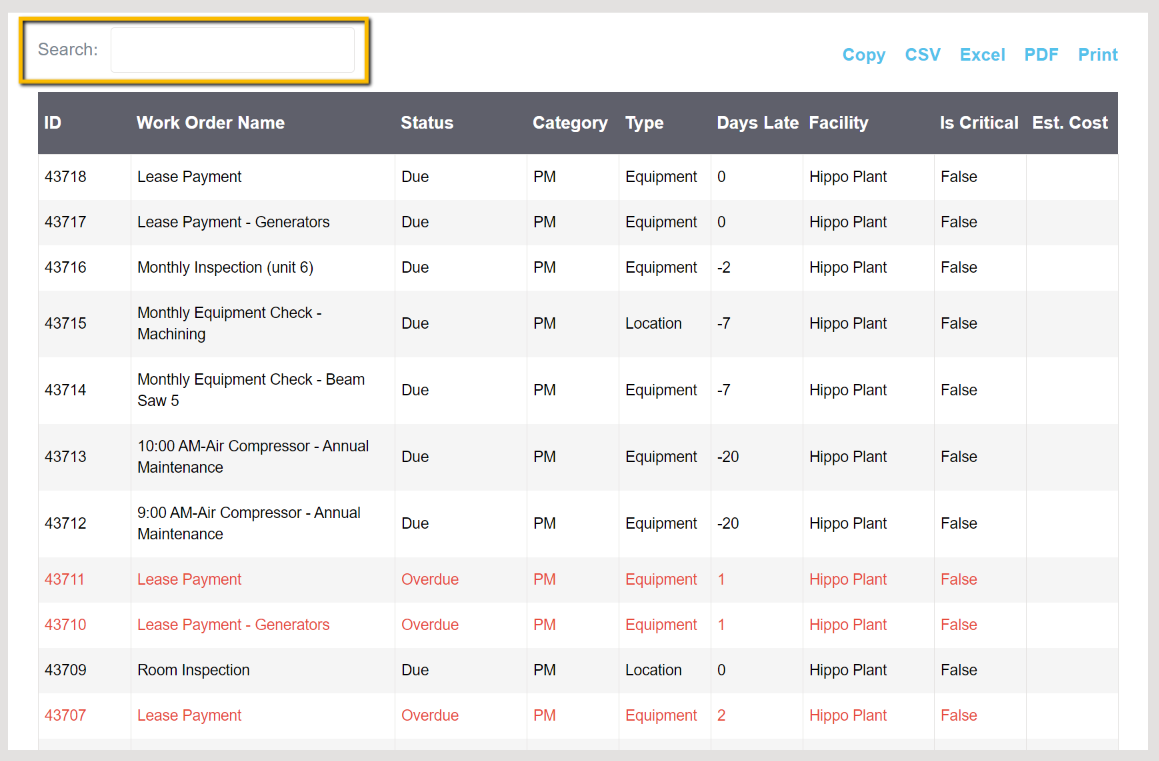
- The next field on the generated report provides details of the work orders. A User can use the search bar on the generated report to look for specific data.
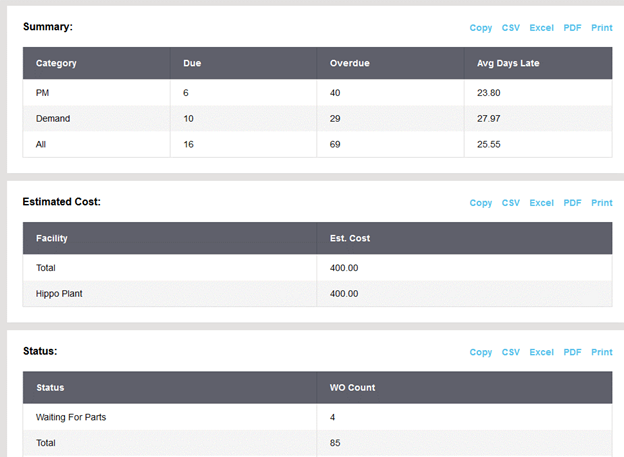
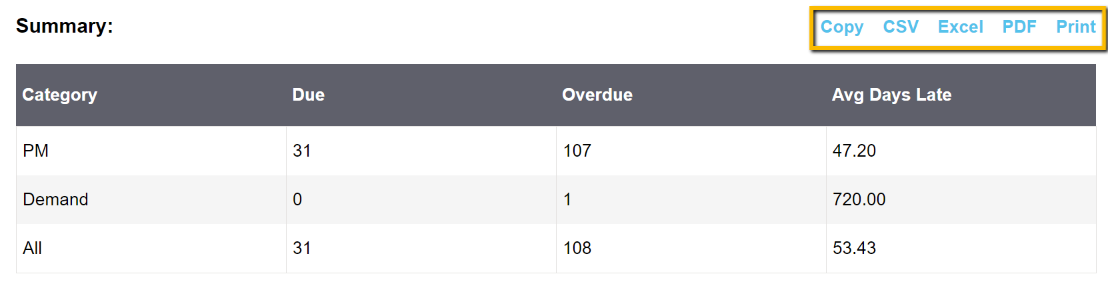
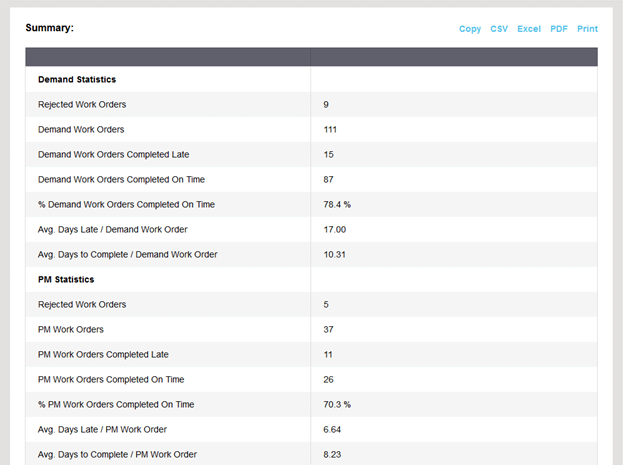
- The last field on the report will give a summary of the status of work orders and costs in tabular form.
- A User can export the tables from a report into CSV, Excel and PDF format by making use of the buttons located at the bottom of each table.a.
- A User can also print the report by making use of the “Print” button located at the bottom of each table.
- A User can also print the report by making use of the “Print” button located at the bottom of each table.
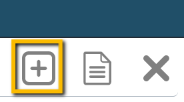
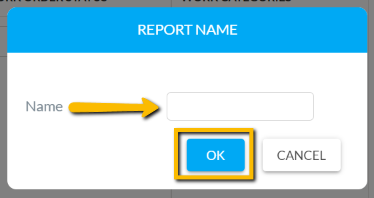
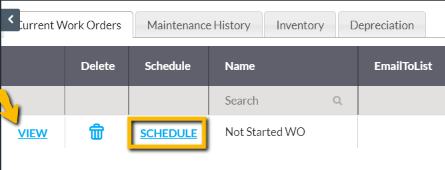
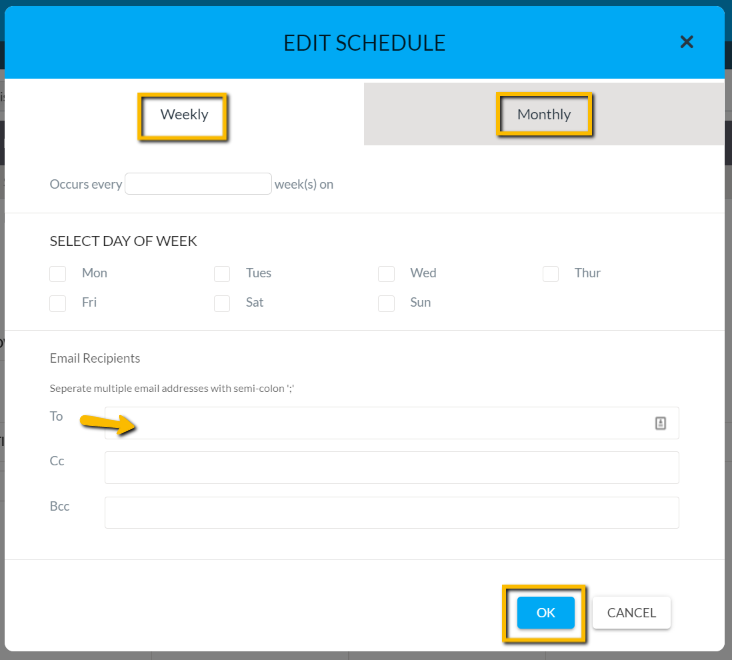
- If a User wishes to regularly run a report, it can be set up to be emailed to him/her on regular basis. Apply all the required filters and click on the “+” icon located in the top right corner. Give this report a Name and click on “OK”.
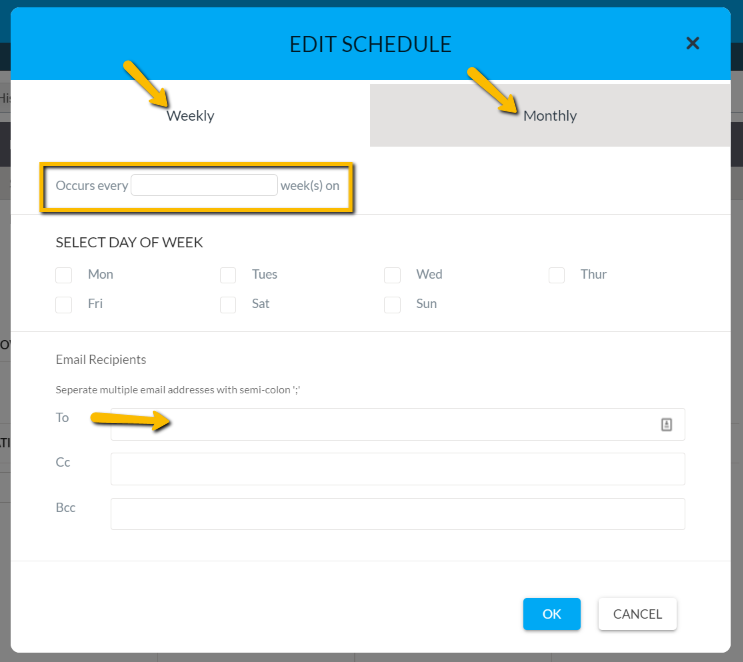
- Once “OK” is clicked, the report will show up at the top of the screen. Click on “Schedule” to set up the schedule for the report. A User can set up a Weekly or Monthly Schedule.

- Add the email addresses of the people a report should be sent to.
This guide will show a User how to run Maintenance History Reports. Maintenance History reports allow the User to report on completed work orders. The results of this report provide valuable data such as maintenance costs, labour hours, and whether work orders have been completed on time or late. The User can run this report from either the Enterprise Level or the Facility Level. When a maintenance history report is run at the enterprise level, it will generate a comparative report from one facility to another. Typically, a User would only run a maintenance history report at the enterprise level to get a snapshot of how much in maintenance costs each facility has incurred, compared to one another. To get the more detailed information regarding a facility’s completed work orders, it should run from the facility level.
Definitions
Show Graphs: Show Graphs will display the Summary graph and the Status graph.
Show Summary/Details: Show Summary/Details that enables a User to select only a summary of just the details.
Work Order Type: Work Order Type allows a User to choose to display Equipment, Location or Vehicle based work orders.

Instructions
- To run a report, click on “Reports” on the Admin panel on the left at Enterprise Level or Facility Level. If the User runs the report at the facility level, he/she can additionally filter through floor plans, locations and vehicles whereas the report at Enterprise Level will provide information per facility.
- Click on the “Maintenance History” tab.
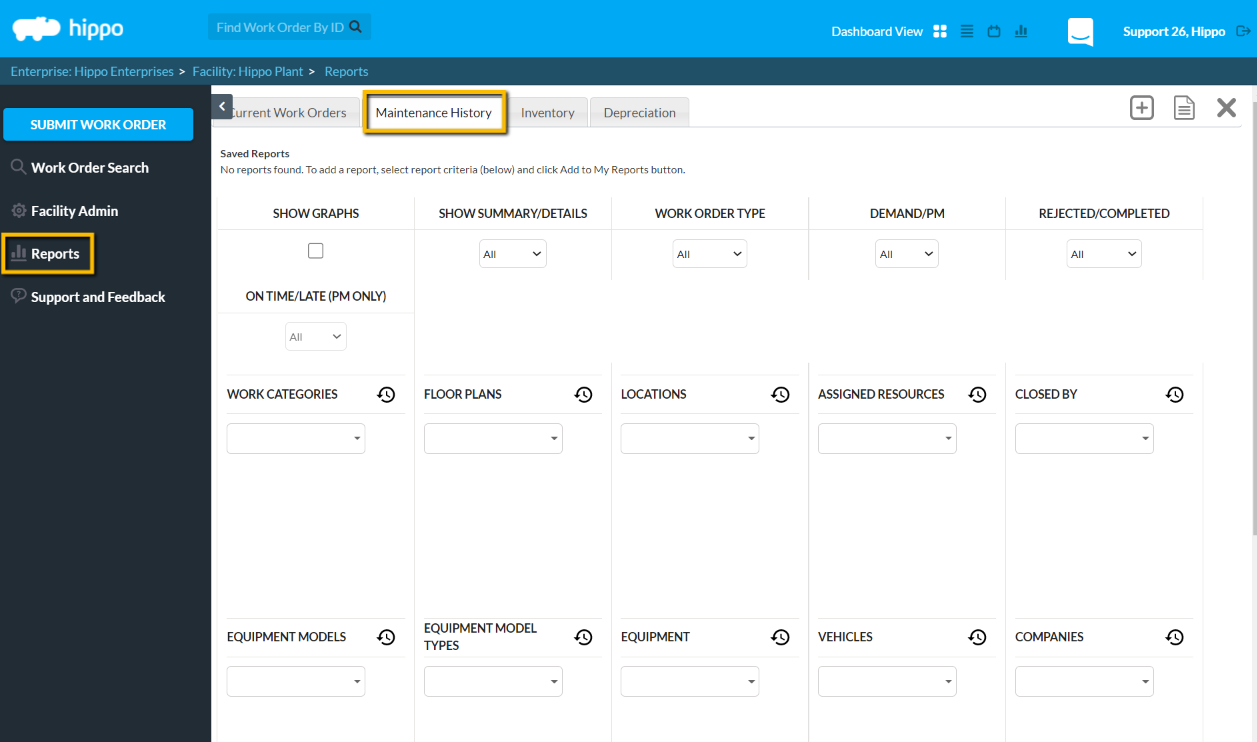
- Apply the filters to the report as required.
- If a User would like to see summary and status graphs on the report, check off “Show Graphs”.
- Select Summary or Details from the drop-down or choose “All” to see both summary as well as details in the report.
- Click in the drop-down menu of Work Order Type to select Equipment, Location or Vehicle or select All to see a report on the work order for all three types.
- Click in the Demand/PM drop-down menu to filter through Demands or PMs or select All to see a report on both PMs and Demand Work Orders.
- Click in the “Rejected/Completed” field to filter through Completed or Rejected Work Orders or select All to see report on both Completed as well as Rejected work orders.
- Click in the “On-Time/Late” field to filter through On-Time or Late Work Orders or select All to see a report on both late and on-time work orders.
- A user can also limit what is seen on work orders by selecting particular Work Categories, Floor Plans, Locations, Assigned Resources, Equipment Models, Equipment Model Types, Equipment, Vehicles, Companies, Part Types and Parts.
- If a user does not select anything in the filter boxes, the report will automatically select everything.
- Make use of the Due Date Range and Completed Date Range fields to filter a report through a certain time period.
- Once a User has applied all the filters, click on “Generate Report” icon located in the top right corner of the screen and a report will pop up in a new window.

- If “Show Graphs” is checked off, a User will see the graphs at the top of the generated report. The graphs give a summary of the status of work orders as well as costs.
- The next field on the generated report the User with details of the work orders. A User can use the search bar on the generated report to look for specific data.
- The generated report will also provide a summary of all work orders in tabulated form.
- A User can export the tables from a report into CSV, Excel and PDF format by making use of the buttons located at the bottom of each table.
- A User can also print the report by making use of the “Print” button located at the bottom of each table.
- If there is a report that is run regularly, the User can set it up to be emailed to him/her on regular basis. Apply all the required filters and click on the + icon located in the top right corner.

- Give this report a Name and click on “OK”.

- Once a User clicks “OK”, the report will show up at the top under the list of saved reports. Click on “Schedule” to set up the schedule for the report. The User can set up a Weekly or Monthly Schedule.
- Add the email addresses of the people that the user may wish to send this report.
This guide will show a User how to run an Inventory Report. Inventory Report provides the User information on all the parts stored in the database. A User can run this report at the Enterprise Level or Facility Level. If a User runs the inventory report at the enterprise level, the User will see a report of parts for all the facilities while the inventory report run at the facility level will give the User information on parts for just that facility.
Definitions
At/Below Min. Qty Only: This allows a User to see a list of all the parts that are at/below minimum quantity only.
Instructions
- To run a report, click on “Reports” on the Admin panel on the left at Enterprise Level or Facility Level. If a User runs the report at the facility level, vehicles can also be filtered through, whereas the report at Enterprise Level will provide the User information per facility.
- Click on the “Inventory” tab.
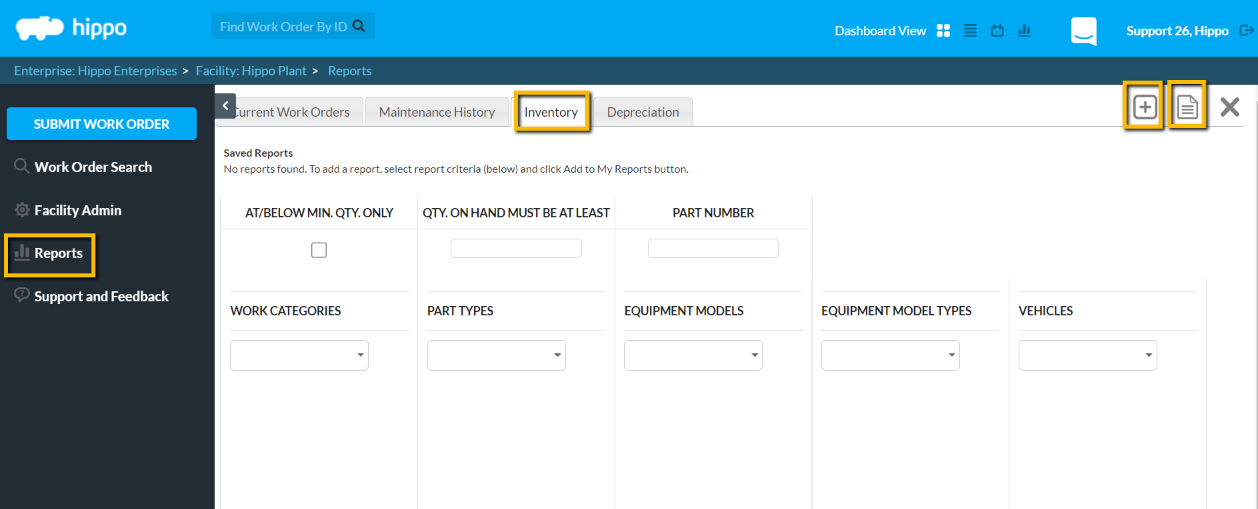
- Apply the filters to the report as required.
- Check off “At/Below Min. Qty. Only” if just a list of parts that are at/below minimum quantity is to be viewed.
- Make use of the “Qty. on Hand must be at least” field if the user wants to see a report on parts that above a certain value.
- A User can also filter through Part Number, Work Categories, Part Types, Equipment Models and Equipment Model Types as required.
- Once a User has applied all the filters, click on “Generate Report” icon located in the top right corner to see the Inventory Report.
- The generated report will give the User details on parts as well as the value of the total parts.
- If a User runs a report by checking off “At/Below Min. Qty. Only”, the report will give the User information on quantity to order and order cost.
- If there is a report that a User runs regularly, the User can set it up to be emailed to the User on regular basis. Apply all the required filters and click on “+” icon located in the top right corner. Give this report a Name and click on “OK”.

- Upon clicking “OK”, the report will show up at the top under the list of saved reports. Click on “Schedule” to set up the schedule for the report. A User can set up a Weekly or Monthly Schedule.
- Add the email addresses of the people that the User wants to send this report.
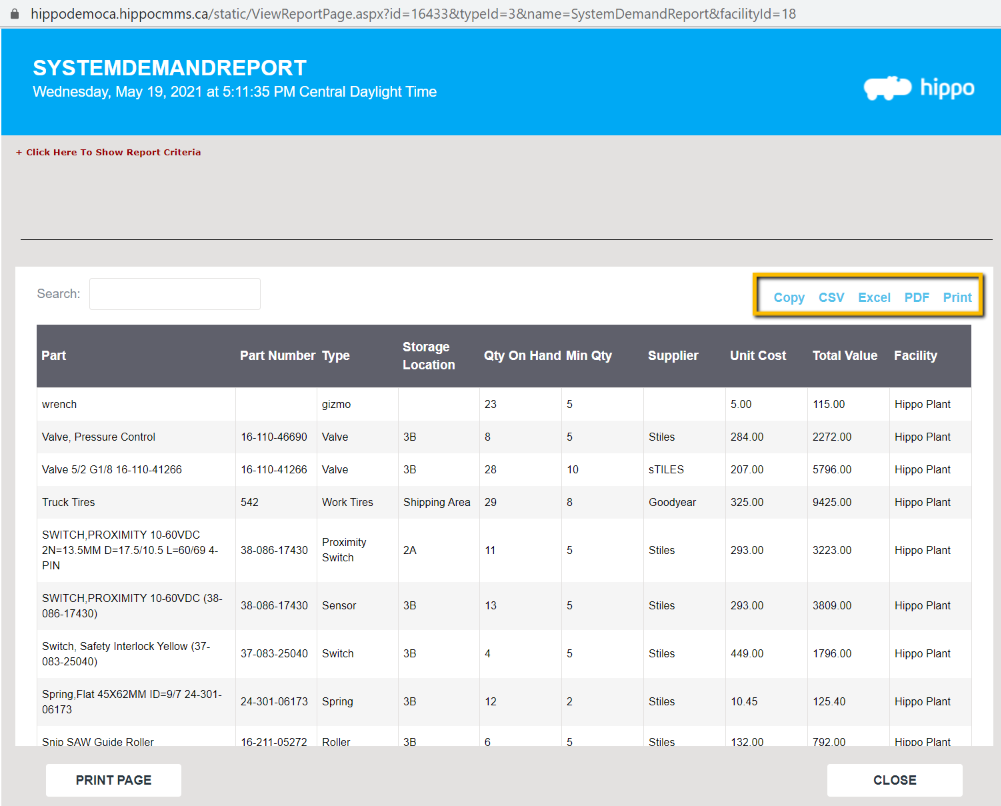
- A User can copy the report, export it into CSV, Excel or PDF format and print it if required.